Why does it matter how many different species live in an area, and how do you actually measure it? This page covers what biodiversity is, how to measure it with species richness and the index of diversity, and how farming affects it.
What is Biodiversity?
What you need to know (from the AQA specification)
What you need to know (from the AQA specification)
Biodiversity can relate to a range of habitats, from a small local habitat to the Earth. Species richness is a measure of the number of different species in a community.
Biodiversity is the number and variety of living organisms in a particular area. It can be measured at different scales:
- A single field, pond, or hedgerow
- A country or biome
- The whole Earth
Biodiversity has several components, but at this level you need to be able to measure it using:
- Species Richness
- Index of Diversity
Definition: Species richness
Species richness is a measure of the number of different species in a community.
Species richness is simply a count of species: it doesn’t tell you how many individuals of each species are present.
Why is species richness alone not enough to measure biodiversity?
Why is species richness alone not enough to measure biodiversity?
Two communities could both have 10 species, but one might have 1000 individuals all of one species and 1 individual of each of the other 9. The species richness is the same, but the community dominated by one species is much less diverse in a meaningful sense. The index of diversity captures this.
Index of Diversity
What you need to know (from the AQA specification)
What you need to know (from the AQA specification)
An index of diversity describes the relationship between the number of species in a community and the number of individuals in each species. Calculation of an index of diversity (d) from the formula:
d = N(N − 1) / Σn(n − 1)
where N = total number of organisms of all species and n = total number of organisms of each species.
Students could be given data from which to calculate an index of diversity and interpret the significance of the calculated value of the index.
Definition: Index of diversity
An index of diversity (d) describes the relationship between the number of species in a community and the number of individuals in each species.
So unlike species richness, it takes into account both how many species there are and how evenly the individuals are spread between them.
$$d = \frac{N(N-1)}{\Sigma n(n-1)}$$
Where:
- N = total number of organisms of all species
- n = number of organisms of each species
- Σ = sum of (n(n−1)) calculated for every species
Note: You’re usually given this formula in the exam, but you need to know how to use it and what N and n mean.
A higher value of d = greater biodiversity. A community where many species each have roughly equal numbers of individuals will have a much higher d than a community dominated by one species.
Worked Example
Below is a worked example using three plant species found in a field. To calculate the index of diversity:
- Work out n(n − 1) for each species
- Add these up to get Σn(n − 1)
- Work out N(N − 1), using the total number of organisms
- Divide N(N − 1) by Σn(n − 1)
| Species | Number of individuals (n) | n(n−1) |
|---|---|---|
| Daisy | 20 | 20 × 19 = 380 |
| Buttercup | 15 | 15 × 14 = 210 |
| Clover | 5 | 5 × 4 = 20 |
| Total (N) | 40 | Σ = 610 |
$$d = \frac{40 \times 39}{610} = \frac{1560}{610} \approx 2.56$$
On its own, a d value of 2.56 doesn’t tell you much. The index of diversity is most useful for comparing communities: for example, if a second field had d = 1.4, the first field would have the higher biodiversity.
What is the difference between high species richness and a high index of diversity?
What is the difference between high species richness and a high index of diversity?
High species richness = many different species present.
High index of diversity = many species AND those species are present in roughly equal numbers.
A community can have high species richness but a low index of diversity if one species dominates and all others are rare. For example: 10 species present, but 990 out of 1000 individuals belong to one species. d would be very low.
Tip
Don’t say a high index of diversity simply means “more species”. It means more species and more even distribution of individuals across those species. A low d can occur even when species richness is high, if one species dominates.
Why biomass is sometimes used instead of number of individuals
When organisms are very small (e.g. fungi) or grow tightly packed together (e.g. moss or grass), it is not possible to count individuals accurately, because you can’t tell where one organism ends and the next begins. In these cases, biomass (the dry mass of each species) is used as a measure of abundance instead. To find dry mass, samples are dried in an oven until their mass stops changing, then weighed (you’ll learn more about this in Unit 5).
Farming and Biodiversity
What you need to know (from the AQA specification)
What you need to know (from the AQA specification)
Farming techniques reduce biodiversity. The balance between conservation and farming.
Modern intensive farming has led to significant reductions in biodiversity. Key practices that reduce it:
- Clearing land: removing hedgerows and woodland destroys habitats and removes food and shelter for many species
- Herbicide use: kills weed species, reducing plant diversity and removing food sources for insects and other animals
- Pesticide use: kills pests (e.g. insects), but also kills other species that aren’t pests, such as pollinating insects. This removes food for animals further up the food chain, so the number of species of insects, birds and small mammals falls
- Monoculture: growing a single crop species over a large area provides habitat and food for only a limited range of species
Why does a hedgerow support more biodiversity than the centre of a field?
Why does a hedgerow support more biodiversity than the centre of a field?
A hedgerow provides multiple layers (e.g. ground plants, shrubs and trees), and a range of food sources (e.g. berries, insects). The centre of a field is a uniform environment with one crop species.
The Conservation–Farming Balance
Ways farmers can conserve biodiversity include:
- Keeping or replanting hedgerows and leaving field margins of wild plants
- Rotating crops rather than growing the same crop every year
- Using fewer pesticides and herbicides, and only where needed
- Keeping ponds, wetlands and patches of woodland on the farm
Maintaining biodiversity has direct benefits for farmers:
- Natural pest control: predators of pests (e.g. hoverflies, ladybirds, birds) are supported by diverse habitats; this can reduce the need for pesticides
- Pollination: diverse habitats support pollinators (bees, butterflies); crops that require pollination give better yields
- Soil health: diverse plant communities support soil organisms that improve soil structure and fertility
However, it’s important to consider that conservation measures also have costs to the farmer:
- Reduced crop area: land used for hedgerows or wildflower margins is not used for crops, reducing yield and income
- Increased management time and cost
How this topic is tested
This analysis is based on past paper data from 2017 to 2025. It is intended for interest only and is not predictive of what will appear in future papers.
- Tested in 6 of 9 years (2017–2025): 19 question parts worth 38 marks.
- 29th most-examined topic overall by marks, 4th in Unit 4.
Marks by year
Most-tested spec points
- Biodiversity & Species Richness: tested in 8 parts (21 marks)
- Index of Diversity: tested in 10 parts (20 marks)
- Farming & Biodiversity: tested in 3 parts (5 marks)
Also links to: Conservation & Managing Succession, Quantitative Investigation of Variation.
Maths and practical skills
- Sampling in fieldwork (AT k): e.g. 2019 P1 Q3.2
- Using equations (MS 2.3): e.g. 2023 P3 Q5.1
- Moving between graphs, numbers and equations (MS 3.1): e.g. 2024 P3 Q6.4
- Choosing and using a statistical test (MS 1.9): e.g. 2017 P3 Q4.3
Tips from examiner reports
What students commonly get wrong
- Low index of diversity: one species dominatesWatch out: a low d with high species richness means one or a few species are present in very large numbers (they dominate). It doesn't mean every species has only a few individuals. 2023 P3 Q5.2
- Representative samples: random and manyWatch out: to make samples representative, take random samples and a large number of them (or keep going until the running mean is stable). "Using the same equipment" makes it fair, not representative. 2019 P1 Q3.2
- Farming questions: link it to the farmerWatch out: when asked for an advantage to a farmer, don't stop at "more biodiversity". Link it to the farm, e.g. more predators of pests, so fewer pesticides are needed or yield increases. 2019 P1 Q3.4
- Why biomass instead of counting?Watch out: don't just say counting is "difficult". Say why: the individual plants are too small or too numerous to count. 2022 P1 Q1.3
Exam Question Practice
A group of students investigated biodiversity of different areas of farmland.
They collected data in each of these habitats:
- the centre of a field
- the edge of a field
- a hedge between fields.
Their results are shown in Figure 4.
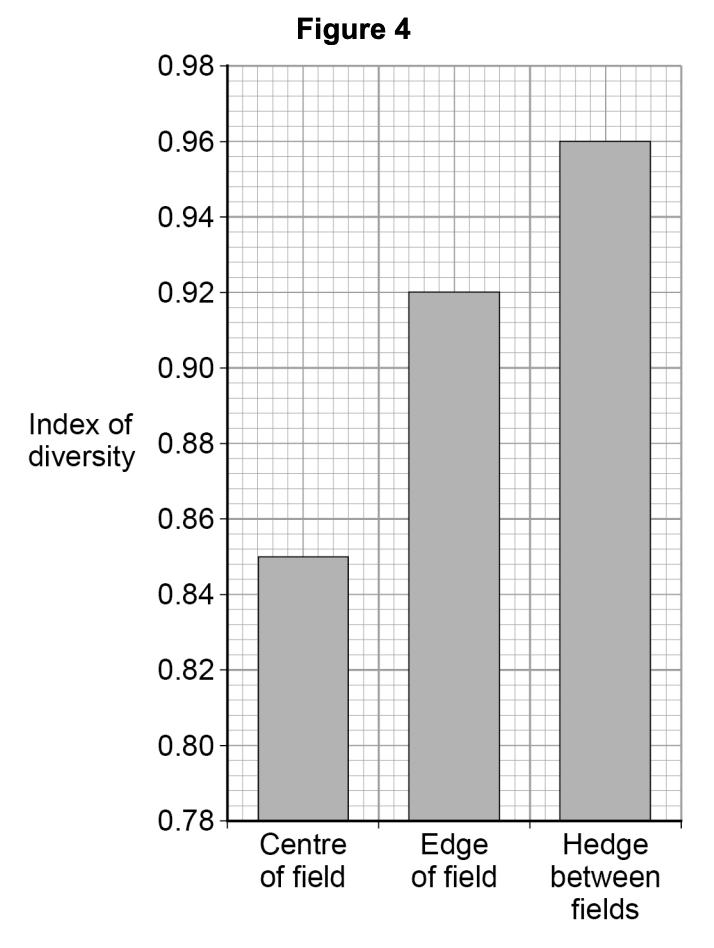
Give two ways the students would have ensured their index of diversity was representative of each habitat.
1 = ________
2 = ________
(2 marks)
Hint
How should sample sites be chosen to avoid bias? How would you know you had taken enough samples?
Mark Scheme
- Random samples (1 mark)
- Large number (of samples)
OR (Continue sampling) until stable running mean (1 mark)
Comments from mark scheme
Tips from examiner reports
Tips from the examiner report
- Representative means random sampling and a large number of samples; fair-test ideas such as using the same equipment or the same area don’t answer this
- Give an idea of size: ‘3 repeats’ or ‘several repeats’ isn’t a large sample
- Repeating at different times of day or in different seasons isn’t what is asked
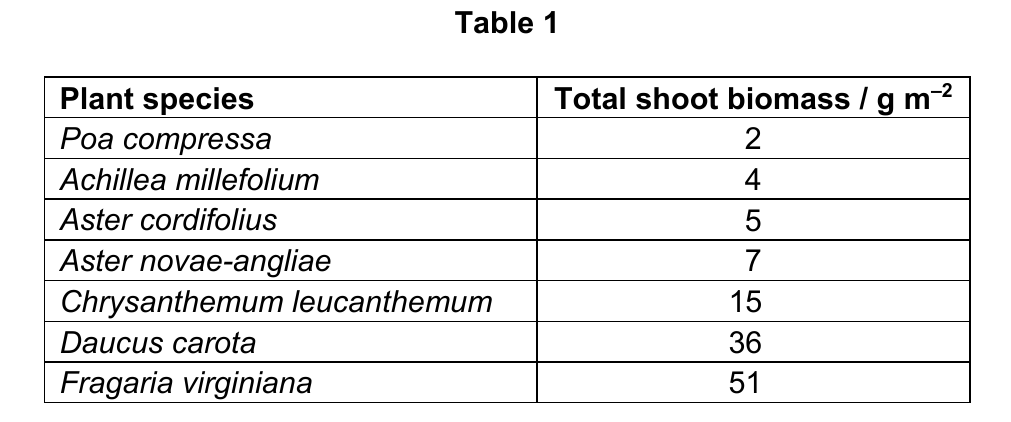
Scientists investigated the effect of the number of fungal species in soil on the diversity of plant species.
Table 1 shows their raw data for soil containing 14 fungal species.
The scientists used this equation to calculate the plant species index of diversity.
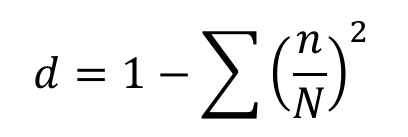
where n = shoot biomass of each plant species
and N = total shoot biomass of all plant species
Use this equation to calculate the index of diversity for the data in Table 1.
Index of diversity = ________
(2 marks)
Hint
Add up the biomass first to find N. Then work out (n/N)² for each species. What’s the last step of the equation?
Mark Scheme
Correct answer for 2 marks, 0.7– 0.71 (2 marks)
Accept for 1 mark,
0.29 – 0.3 (correct calculation not subtracted from 1)
OR 120 (correct total shoot biomass)
Comments from mark scheme
A common correct answer is 0.707
Accept numbers rounding down to 0.71
Tips from examiner reports
Tips from the examiner report
- Use the equation given in the question, not the one you learnt from the specification
- Total the biomass first (N = 120), then add up (n/N)² for every species and subtract from 1: d = 0.71
- Don’t forget the final step of subtracting from 1 (0.29 only scores 1 mark)
Scientists investigated the effect of the number of fungal species in soil on the diversity of plant species.
Table 1 shows their raw data for soil containing 14 fungal species.
Suggest one reason the scientists used biomass instead of the number of individuals of each plant species when collecting data to measure diversity.
(1 marks)
Hint
Picture trying to count individual grass plants in a field. Why might that be hard?
Mark Scheme
Individual organisms could not be identified/separated
OR Too small/numerous to count individuals
OR Too time consuming (1 mark)
Comments from mark scheme
Ignore too difficult to identify/distinguish different species
Ignore too difficult to count unless qualified
Accept reference to fungi for plants
Tips from examiner reports
Tips from the examiner report
- Biomass is used here to measure the abundance of each species, because individual plants are too small or too numerous to count, or can’t be separated
- “Counting is difficult” alone isn’t enough: say why (too small or too many)
- It isn’t about energy flow, pyramids of biomass, or removing water
Scientists investigated the effect that the release of heated water into a river from a power station had on the biodiversity of a local fish community over 29 years.
They measured the species richness and the number of fish of each species at the same site in October every year. The scientists used this information to calculate an index of diversity (d) of fish for each year.
Figure 7 and Figure 8 show their results.
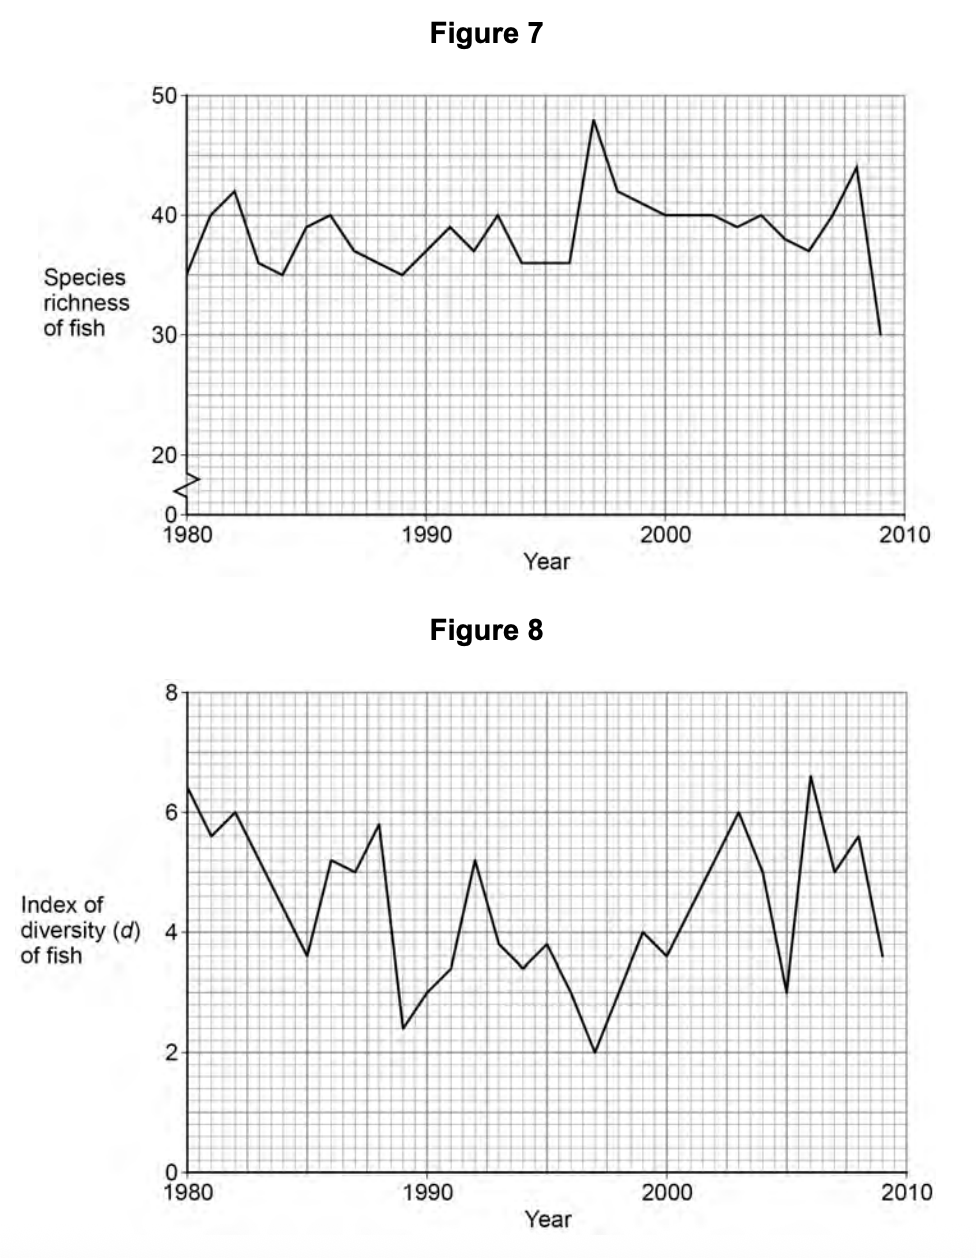
In 1997, the scientists recorded the highest species richness, but the lowest value of d over the 29 years. Describe and explain how these results for 1997 were possible.
(2 marks)
Hint
Species richness only counts species. What else does the index of diversity take into account?
Mark Scheme
- There were many/48 (different) species
OR (1997 had) the highest number of (different) species (1 mark) - (However,) one/a few species were present in (very) large numbers
OR Most species were present in (very) small numbers (1 mark)
Comments from mark scheme
1. Accept a lot/lots of (different) species for many
2. Accept dominated by one/a few species
2. Ignore each/all species were present in (very) small numbers
Tips from examiner reports
Tips from the examiner report
- 1997 had the most species (48), but d was low because one or a few species were present in very large numbers
- Don’t say each or all species had small numbers
- Use the data rather than writing about competition or predation
A group of students investigated biodiversity of different areas of farmland.
They collected data in each of these habitats:
- the centre of a field
- the edge of a field
- a hedge between fields.
Their results are shown in Figure 4.
Farmers are now being encouraged to replant hedges on their land.
Suggest and explain one advantage and one disadvantage to a farmer of replanting hedges on her farmland.
Advantage = ________
Disadvantage = ________
(2 marks)
Hint
Think about what lives in hedges and how it could help or harm the crops. How would a hedge affect the land available and the farm’s income?
Mark Scheme
Advantage -
- Greater (bio)diversity so increase in predators of pests
OR Increase in predators of pests so more yield/income/less pesticides/less damage to crops
OR Increase in pollinators so more yield/income
OR May attract more tourists/subsidies to their farm so more income (from diversification) (1 mark)
Disadvantage -
- Reduced land area for crop growth/income
OR Greater (bio)diversity so increase pest population
OR Increase pest population so less yield/less income/(more) need for pesticides/(more) damage to crops
OR Increased (interspecific) competition so less yield/income
OR More difficult to farm so less income (1 mark)
Comments from mark scheme
Accept description of yield eg crop growth.
For ‘crop’ accept ‘plant’.
Accept other valid suggestions with explanation that will affect the farm as a whole.
Examples of ‘more difficult to farm’ – can’t use large machinery, more difficult to plough/seed/harvest.
Tips from examiner reports
Tips from the examiner report
- Link the advantage to the farmer, not just to wildlife: e.g. more predators of pests, so less crop damage and more income
- ‘More biodiversity’ or ‘more habitats’ on its own doesn’t score
What earned marks
- Less land for crops, so less income, was the most common disadvantage credited
Both marks can be awarded on one line.
Ignore other answers unless they contradict mark points.
2. Accept many/multiple. Ignore several.
2. If a specified number is given, it must be 10 or more.
2. Accept ‘large sample (size)’.