How can you tell how closely related two organisms are, or how much variation there is within a species? This page covers the ways scientists compare genetic diversity, and how to collect and interpret data on variation using random samples, means and standard deviations.
Comparing Genetic Diversity
What you need to know (from the AQA specification)
What you need to know (from the AQA specification)
Genetic diversity within, or between species, can be made by comparing:
- the frequency of measurable or observable characteristics
- the base sequence of DNA
- the base sequence of mRNA
- the amino acid sequence of the proteins encoded by DNA and mRNA.
Students should be able to:
- interpret data relating to similarities and differences in the base sequences of DNA and in the amino acid sequences of proteins to suggest relationships between different organisms within a species and between species
- appreciate that gene technology has caused a change in the methods of investigating genetic diversity; inferring DNA differences from measurable or observable characteristics has been replaced by direct investigation of DNA sequences.
Knowledge of gene technologies will not be tested.
Genetic diversity can be compared within a species (how much variation there is between individuals in a population) or between species (how closely related they are). It can be compared using:
- the frequency of observable characteristics (e.g. height, colour)
- the base sequence of DNA
- the base sequence of mRNA
- the amino acid sequence of proteins
This builds on Investigating evolutionary relationships on the Species and taxonomy page, which explains how each of these comparisons works and why scientists use all three.
From observable characteristics to DNA sequencing
Scientists used to work out genetic differences by comparing observable characteristics. Gene technology has changed this: comparing characteristics has largely been replaced by direct sequencing of DNA. (You don’t need to know how gene technologies work for this unit, but they come up in Unit 8.)
Why can observable characteristics be misleading when studying genetic diversity?
Why can observable characteristics be misleading when studying genetic diversity?
Two unrelated species may look similar because they evolved in the same type of environment, while closely related species can look very different. Observable characteristics are also affected by both genes and the environment, so they don’t just show genetic differences.
What are the advantages of DNA/mRNA sequencing over studying observable characteristics?
What are the advantages of DNA/mRNA sequencing over studying observable characteristics?
It’s more efficient, more precise, and unaffected by environmental variation in phenotype.
Tip
Be specific with your terminology when describing these comparisons: say DNA / RNA base sequence comparison, not just “DNA sequencing” or “DNA analysis”. Include the word base. See also species and taxonomy.
Interpreting sequence data
When you are given data comparing base sequences or amino acid sequences:
- Count the number of differences (or identical bases / amino acids) between each pair of organisms
- The fewer the differences, the more closely related the organisms are (they share a more recent common ancestor)
- Differences build up over time, so the longer ago two organisms diverged, the more differences there are
| Organism | DNA base sequence |
|---|---|
| A | ATG CCT GAA |
| B | ATG CCA GAA |
| C | ATC CGA GTA |
Which two organisms are most closely related?
Which two organisms are most closely related?
A and B. Their sequences differ by only 1 base (the 6th base: T in A, A in B). A and C differ by 4 bases, and B and C by 3 bases.
Quantitative Investigations of Variation
What you need to know (from the AQA specification)
What you need to know (from the AQA specification)
Quantitative investigations of variation within a species involve:
- collecting data from random samples
- calculating a mean value of the collected data and the standard deviation of that mean
- interpreting mean values and their standard deviations.
Students will not be required to calculate standard deviations in written papers.
Quantitative investigations allow us to study the variation within a species.
Random Sampling
Random sampling can be used to collect data from a population which you wish to study.
Method/Conditions
- Use random coordinates (e.g. generated from a table of random numbers or a calculator) to select individuals
- The sample must be large enough to be representative of the population. Continue until the running mean stabilises (stops changing significantly with each new measurement)
Why must samples be large and random?
Why must samples be large and random?
A small sample may not capture the full range of variation in the population. It is less likely to be representative of the true mean. A biased sample (e.g. choosing the largest individuals) would skew the mean. Large, random samples give results that are more likely to reflect the true population.
Mean and Standard Deviation
Once data are collected:
- Calculate the mean (x̄): the average value for your sample
- Calculate the standard deviation (s): a measure of how spread out the data are around the mean
You won’t need to calculate a standard deviation in the exam, but you’ll often be given values and asked to interpret them.
Interpreting standard deviation:
- Small SD: the data points are close to the mean, so there is low variation
- Large SD: the data points are widely spread, so there is high variation
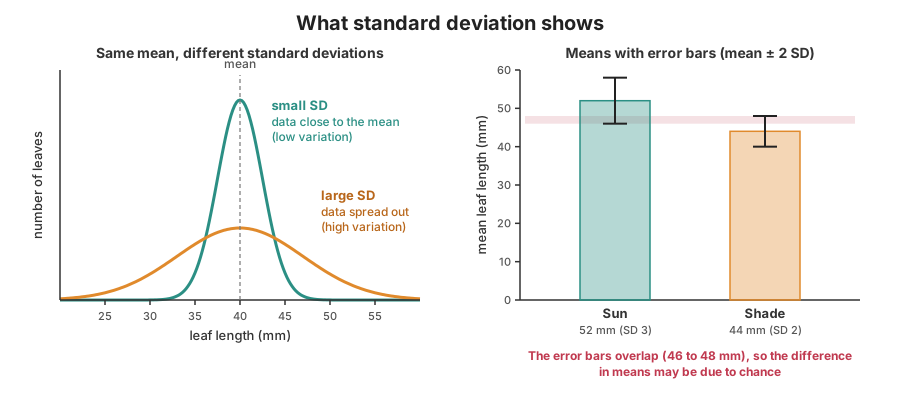
Practice: population X has a mean leaf length of 40 mm (SD 2 mm). Population Y has a mean of 40 mm (SD 8 mm). Which population shows more variation?
Practice: population X has a mean leaf length of 40 mm (SD 2 mm). Population Y has a mean of 40 mm (SD 8 mm). Which population shows more variation?
Population Y. Both have the same mean, but Y has a much larger standard deviation, so its leaf lengths are more spread out around the mean.
Why use 2 standard deviations? When data follows a bell-shaped curve, most of it (about 95%) lies within 2 SD either side of the mean. So “mean ± 2 SD” gives the range where most of the values for that group fall. Exam questions often remind you of this.
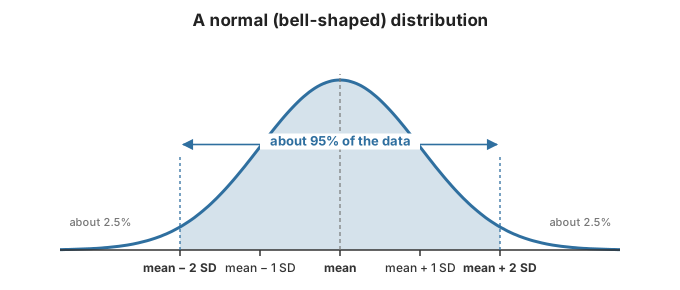
To compare two groups:
- Work out the range for each group: from mean − 2 SD to mean + 2 SD
- If the two ranges overlap, the difference in means may be due to chance
- If they don’t overlap, the difference is probably not due to chance (but a statistical test is needed to be sure)
Why does overlap mean the difference might be due to chance?
Why does overlap mean the difference might be due to chance?
Each range shows where most of the values for that group lie.
- If the ranges overlap, lots of individuals in one group have values that are just as common in the other group. The two groups aren’t clearly different, so the difference between their means could easily have happened by chance (e.g. by which individuals happened to be sampled).
- If the ranges don’t overlap, almost every value in one group is higher than almost every value in the other. A difference that clear is very unlikely to happen just by chance.
Practice: leaves in the sun have a mean length of 52 mm (SD 3 mm). Leaves in the shade have a mean of 44 mm (SD 2 mm). The mean ± 2 SD includes 95% of the data. Do the standard deviations suggest the difference in means is likely to be due to chance?
Practice: leaves in the sun have a mean length of 52 mm (SD 3 mm). Leaves in the shade have a mean of 44 mm (SD 2 mm). The mean ± 2 SD includes 95% of the data. Do the standard deviations suggest the difference in means is likely to be due to chance?
Work out mean ± 2 SD for each group:
- Sun: 52 − 6 = 46 mm to 52 + 6 = 58 mm
- Shade: 44 − 4 = 40 mm to 44 + 4 = 48 mm
The ranges overlap (between 46 and 48 mm), so the difference in means may be due to chance. A statistical test would be needed to be sure.
Statistical Testing: Student’s t-test
A statistical test starts with a null hypothesis: that there is no difference between the two means (any difference is due to chance). The test tells you how likely it is that you’d get your results if the null hypothesis were true.
To find out whether a difference between two means is statistically significant, use the Student’s t-test.
What does a t-test do? It compares the means of two groups, taking into account how spread out the data are (the standard deviations) and how many measurements were taken. The bigger the difference between the means, and the less spread out the data, the less likely it is that the difference is just due to chance. The test gives you a probability (p) that the difference is due to chance.
You don’t need to calculate a t-test in the exam, but you do need to know when to use it and how to interpret the result.
- p < 0.05: the difference is statistically significant. This means there is less than a 5% probability the difference occurred by chance
- p > 0.05: the difference is not statistically significant, so it could be due to chance
Practice: a t-test comparing the mean leaf lengths of two populations gives p = 0.02. What can you conclude?
Practice: a t-test comparing the mean leaf lengths of two populations gives p = 0.02. What can you conclude?
p = 0.02 is less than 0.05, so the difference between the means is statistically significant. There is less than a 5% probability that the difference is due to chance.
(If p had been 0.3, the difference would not be significant: it could be due to chance.)
Tip
Don’t say results “are due to chance” or “are not due to chance”. Always phrase in terms of probability: “there is less than a 5% probability that this difference occurred by chance” (p < 0.05). Never say results “prove” a conclusion. Statistics can only indicate probability, not certainty.
How this topic is tested
This analysis is based on past paper data from 2017 to 2025. It is intended for interest only and is not predictive of what will appear in future papers.
- Tested in 1 of 9 years (2017–2025): 3 question parts worth 11 marks.
- 46th most-examined topic overall by marks, 7th in Unit 4.
- Not tested in 2023–2025.
Marks by year
Most-tested spec points
- Quantitative Investigation of Variation: tested in 1 part (5 marks)
- Comparing Genetic Diversity: tested in 1 part (3 marks)
Also links to: Biodiversity & Species Richness.
Maths and practical skills
- Sampling in fieldwork (AT k): e.g. 2017 P3 Q4.2
- Choosing and using a statistical test (MS 1.9): e.g. 2017 P1 Q10.3
Tips from examiner reports
What students commonly get wrong
- Due to chance: talk about the difference, not the resultsWatch out: don't say the results are due to chance or not significant. Say the difference between the means is (or isn't) likely to be due to chance, or is (or isn't) significant. 2023 P1 Q5.5
- Standard deviations: use 2 × SD and compare rangesWatch out: if a table gives one standard deviation but the question says mean ± 2 SD covers 95% of the data, use 2 × SD. Give both ranges (four numbers), then say whether they overlap and what that means for the difference in means. 2023 P1 Q5.5
Exam Question Practice
Figure 3 shows two different ways of classifying the same three species of snake.
- Classification X is based on the frequency of observable characteristics
- Classification Y is based on other comparisons of genetic characteristics.
All three species of snake belong to the Python family.
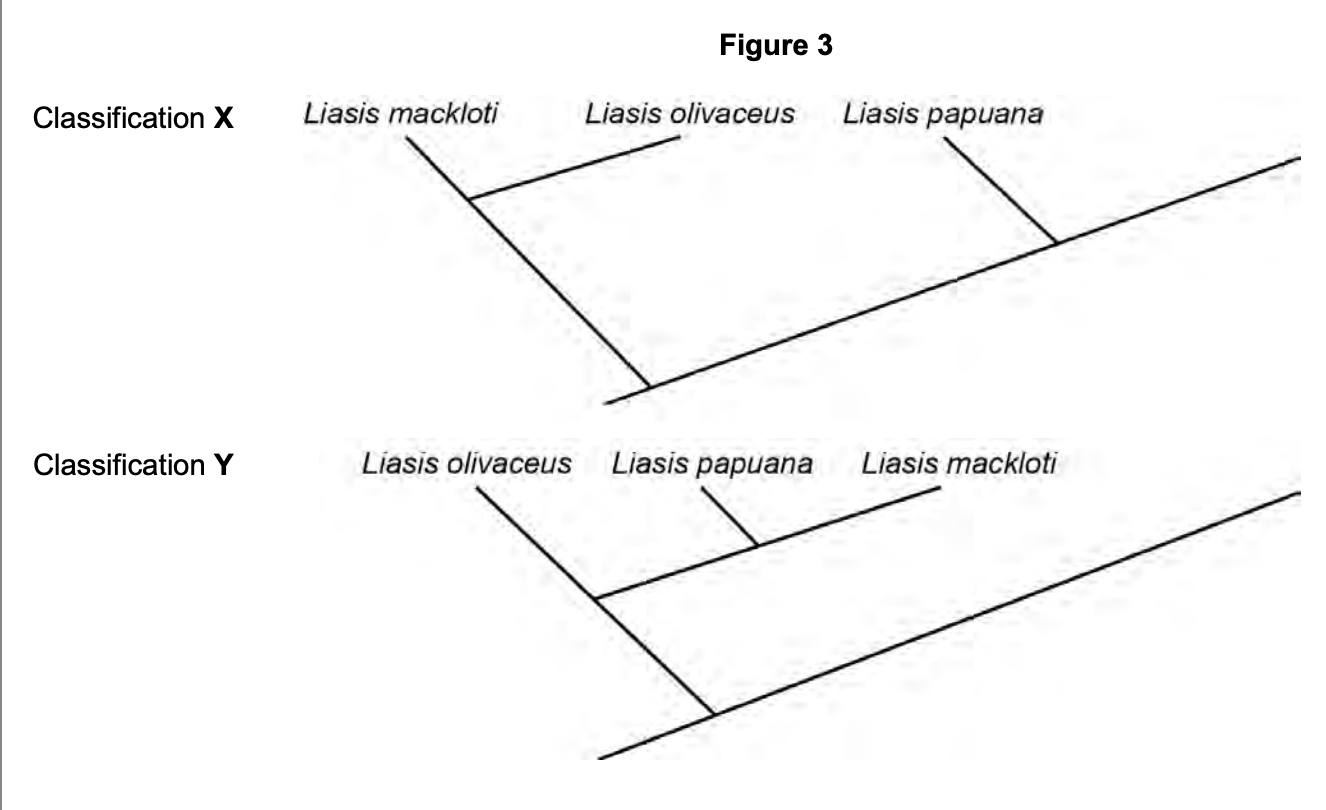
State three comparisons of genetic diversity that the scientists used in order to generate Classification Y.
(3 marks)
Hint
Classification X used observable characteristics. Which three molecular sequences can be compared instead?
Mark Scheme
- The (base) sequence of DNA (1 mark)
- The (base) sequence of mRNA (1 mark)
- The amino acid sequence (of proteins) (1 mark)
Comments from mark scheme
Tips from examiner reports
Tips from the examiner report
- Learn the three comparisons in the specification: the base sequence of DNA, the base sequence of mRNA and the amino acid sequence of proteins
An environmental scientist investigated a possible relationship between air pollution and the size of seeds produced by one species of tree.
He was provided with a very large number of seeds collected from a population of trees in the centre of a city and also a very large number of seeds collected from a population of trees in the countryside.
Describe how he should collect and process data from these seeds to investigate whether there is a difference in seed size between these two populations of trees.
(5 marks)
Hint
How would you choose which seeds to measure, and how many? What would you measure, and which test compares two means?
Mark Scheme
Max 5 marks
- Use random sample of seeds (from each population) (1 mark)
- Use (large enough) sample to be representative of whole population (1 mark)
- Indication of what size was measured eg mass (1 mark)
- Calculate a mean and standard deviation (for each population) (1 mark)
- Use the (Student’s) t-test (1 mark)
- Analyse whether there is a significant difference between (the means of) the two populations (1 mark)
Comments from mark scheme
1. Accept described, suitable method of random sampling.
1. Reject description of inappropriate method of random sampling (eg random coordinates in the field/use of quadrats)
2. Accept ‘running mean does not change’
2. For representative accept ‘reliable, reproducible, repeatable’ OR a mean close to the true value.
5. Accept ‘Use 95% confidence limits’
6. Reject unqualified references to results being significant
Tips from examiner reports
Tips from the examiner report
- Use the information given: the seeds have already been collected, so don’t describe collecting seeds or measuring pollution
- Name one appropriate statistical test (a t-test); listing several isn’t credited
A student investigated the use of cinnamon oil as an antimicrobial substance. She investigated the effect of cinnamon oil on the growth of five different bacterial cultures grown on agar plates.
The student kept the plates at 25 °C for 24 hours.
Figure 5 shows what one of her plates looked like after 24 hours.
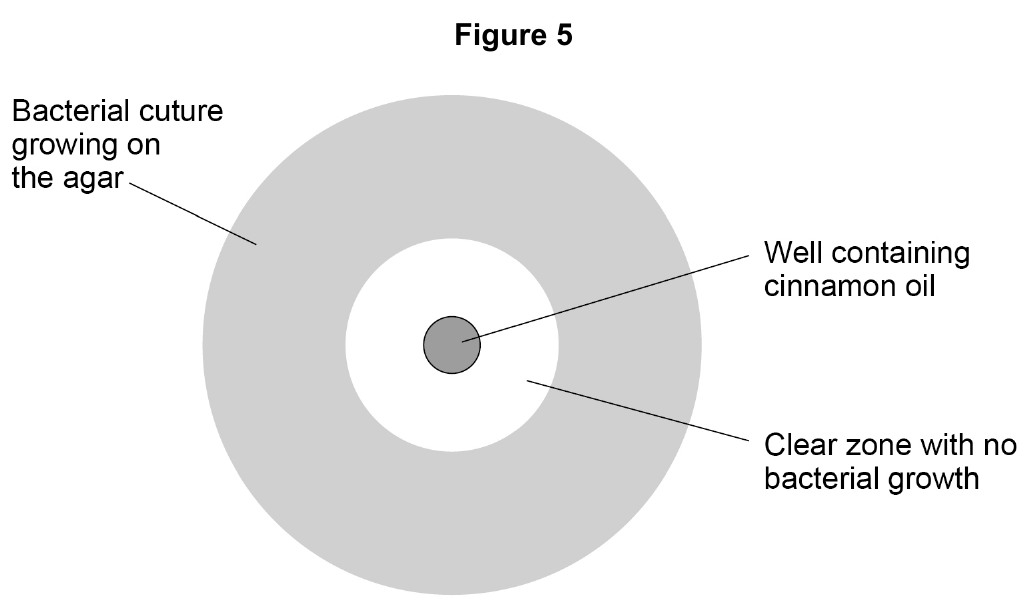
The student measured the diameter of the clear zone with no bacterial growth around each well. She made these measurements to the nearest whole mm
Table 1 shows her results.
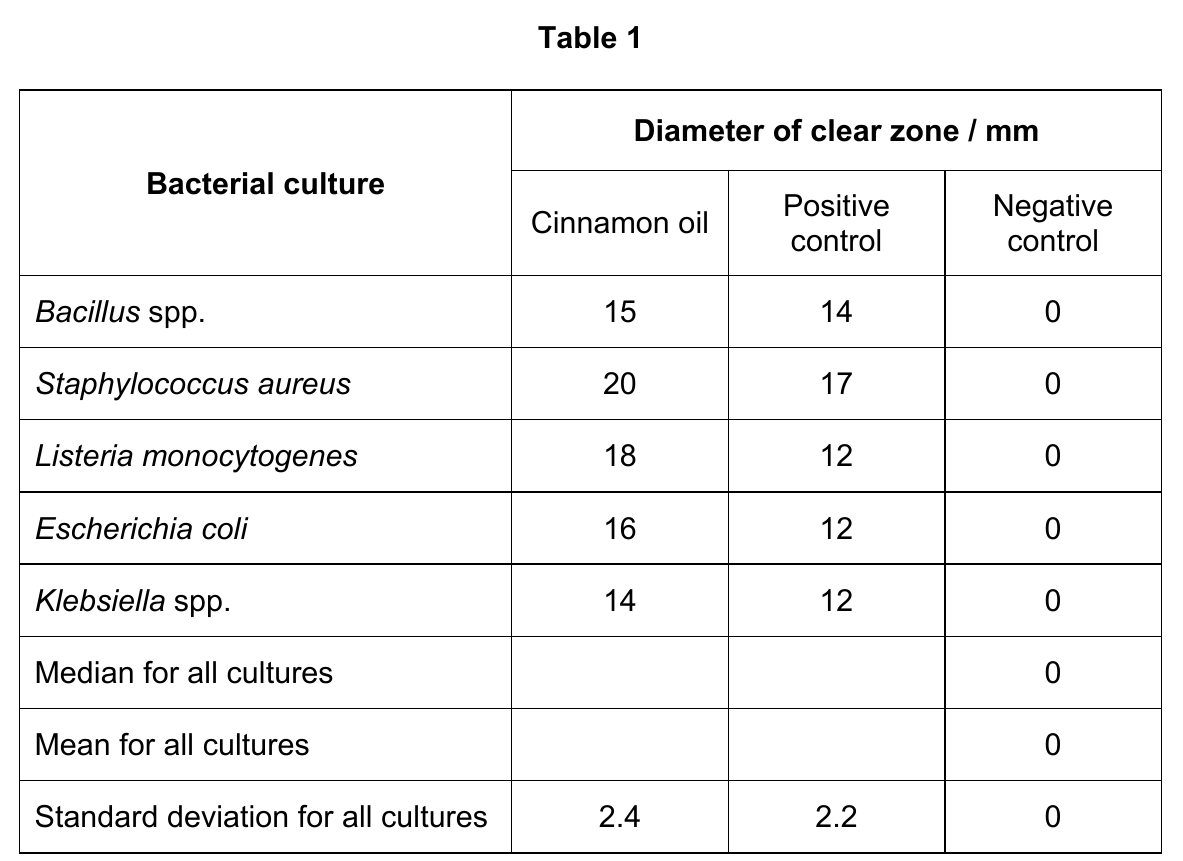
The mean ± 2 standard deviations includes over 95% of the data.
Use this information to consider whether the standard deviations suggest the differences in means are likely to be due to chance.
Explain your answer, including at least one calculation.
(2 marks)
Hint
For 95% confidence, you need 2 standard deviations. What does overlap/no overlap of these ranges tell you about significance of DIFFERENCES?
Mark Scheme
- (Mean ± 2SD) 12.2 to 21.8 and 8.6 to 17.4
OR (Mean ± 2SD) 11.8 to 21.4 and 9(.0) to 17.8
OR (Mean ± 1.96 SD) 12.3 to 21.7 and 8.7 to 17.3
OR (Mean ± 1.96 SD) 11.9 to 21.3 and 9.1 to 17.7 (1 mark) - (SD) overlap so difference (likely to be) due to chance
OR (SD) overlap so (likely) no significant difference (in means) (1 mark)
Comments from mark scheme
1. Accept ECF for 1 mark, correct SDs calculated using incorrect means in 05.4
2. Accept ECF for 1 mark, correct explanation based on correct SDs calculated from incorrect means in 05.4
2. Reject results are due to chance OR results are significant
Tips from examiner reports
Tips from the examiner report
- The table gives one SD, so double it: 17 ± 4.8 = 12.2 to 21.8, and 13 ± 4.4 = 8.6 to 17.4
- The ranges overlap, so the difference in means is likely due to chance (not significant)
- Talk about the “difference”, not “the results”, being due to chance
The percentage of saturated fatty acids compared with unsaturated fatty acids found in lipid stores in seeds differs in different populations.
Scientists investigated two populations of the plant, Helianthus annuus.
The scientists grew young plants from seeds collected from each population. They placed the seeds on wet tissue paper so that the root growth was visible.
They grew seeds from each population at two temperatures:
- warm temperature of 24 °C
- cool temperature of 10 °C
After 10 days, the scientists measured the length of each root.
Table 6 shows some of the properties of the two populations and the scientists’ results.
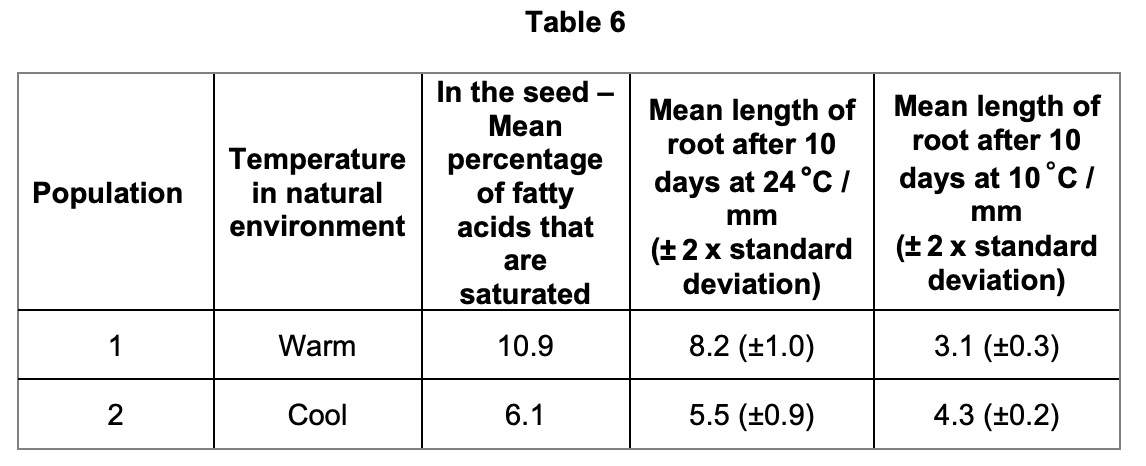
The mean ±2 × standard deviation includes 95% of the data.
It is known that:
- during respiration saturated fatty acids yield more energy than unsaturated fatty acids
- saturated fatty acids have higher melting points than unsaturated fatty acids
- lipases in seeds act more rapidly on liquid substrates.
Use this information and Table 6 to show how each population is better adapted for its natural environment when compared with the other population.
(4 marks)
Hint
For each temperature, which population grew longer roots? Use the three facts to explain why each population’s fatty acids suit its natural environment.
Mark Scheme
- Population 1 grew longer roots in warm temperatures and population 2 grew longer roots in cool temperatures (1 mark)
- Standard deviations do not overlap so difference (in mean) unlikely to be/not due to chance (1 mark)
- Population 1 (is better adapted to warm conditions because it) has more saturated fatty acids so more energy available (and more growth) (1 mark)
- Population 2 (is better adapted to cool conditions because it) has more unsaturated/liquid fatty acids so more lipase activity (and more growth) (1 mark)
Comments from mark scheme
2. Accept: ‘Standard deviations do not overlap showing difference (in mean likely to be) significant’
3. and 4. Accept for ‘fatty acids’, fat
Tips from examiner reports
Tips from the examiner report
- Compare the two populations with each other, not the two temperatures within one population
- Population 1 grows longer roots when warm and population 2 when cool, and the ± 2 SD ranges don’t overlap
- Link to the fatty acids: population 1 has more saturated fatty acids, which give more energy; population 2 has more unsaturated (liquid) fatty acids, which lipase breaks down faster in the cool
Ecologists investigated changes in grassland communities on large islands off the coast of Scotland between 1975 and 2010. On each island, they used data from a number of sites to determine the change in mean species richness and the change in mean index of diversity.
Some of the ecologists’ results are shown in Table 2. They carried out a statistical test to find out whether any differences between the 1975 and 2010 means were significant. The values for P that they obtained are also shown in Table 2.
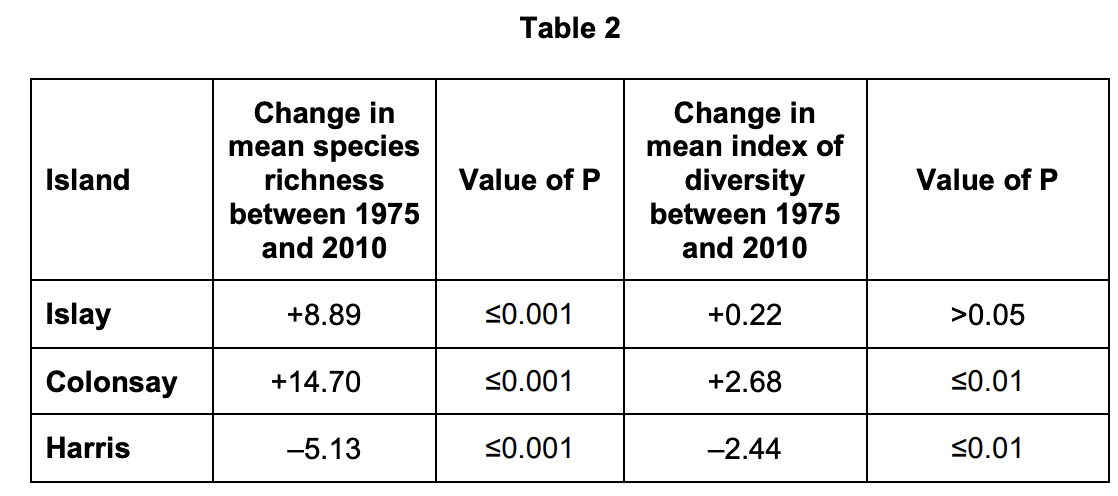
Do these data show that there were any significant changes in the grassland communities on these islands? Give reasons for your answer.
(3 marks)
Hint
For each change, is P above or below 0.05? What does that tell you about the probability the difference is due to chance?
Mark Scheme
- Significant increase in species richness on Islay and Colonsay and (significant) fall on Harris (1 mark)
- Change in diversity on Islay not significant (1 mark)
- Greater than 0.05/5% probability of getting this change/difference by chance (on Islay)
OR (For other differences) less than 0.001/0.1% probability of getting this change/difference by chance (for species richness on Colonsay, Harris, Islay)
OR Less than 0.01/1% probability of getting this change/difference by chance (for diversity index on Colonsay, Harris) (1 mark)
Comments from mark scheme
2. Accept converse about significance of differences in other cases
3. Reject results are due/not due to chance
3. Ignore refs to P unqualified
Tips from examiner reports
Tips from the examiner report
- A P value tells you the probability that the difference between the means is due to chance; it doesn’t say whether the ‘results’ are accurate or reliable
- Read ≤ and > correctly: only the change in diversity on Islay isn’t significant
- Say which changes are increases and which is a decrease
- Assume published data were collected correctly
1. Accept ‘DNA hybridisation’