Exam-style questions written in the same style as AQA A-level Biology papers.
At the moment the questions cover Units 1–4 only. More are being added.
Filter by unit or topic, or press Practice to work through the questions one at a time.
ATP is the immediate source of energy for cells.
Describe the structure of ATP, and outline how named enzymes break down and resynthesise it.
(4 marks) Revise this topic ↗
Hint
What three components make up ATP? What happens to water in the reactions that make and break ATP?
Mark Scheme
- ATP is made of ribose, adenine and three phosphate groups (1 mark)
- ATP hydrolase breaks ATP down into ADP + Pi in a hydrolysis reaction (1 mark)
- ATP synthase makes ATP from ADP + Pi (1 mark)
- In a condensation reaction (1 mark)
Also accepted / rejected
Tips
- ATP structure = adenosine (adenine + ribose) + 3 phosphate groups: don’t just say “ADP + Pi”
- Say ribose specifically, not just “pentose sugar”
- Hydrolysis of ATP uses water and is catalysed by ATP hydrolase: don’t confuse hydrolysis with condensation
- Don’t spend time describing ATP as an “immediate energy source” when the question asks about structure and reactions
Mannan is a polysaccharide found in some plant cell walls. The mannan monomer is β-mannose, a hexose sugar with the same chemical formula as glucose.
Figure 1 shows the monomer that forms mannan and part of the mannan polymer.
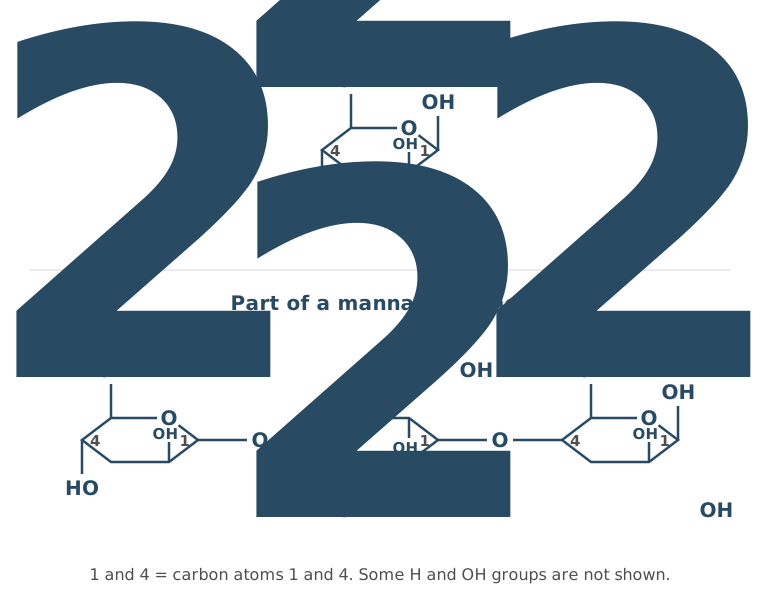
Mannan has a similar structure to cellulose.
Use Figure 1 to describe three ways the structure of mannan is similar to the structure of cellulose.
(3 marks) Revise this topic ↗
Hint
Focus on structural features shown in the diagram. Are the monomers α or β? What type of bond joins them? How are the monomers arranged?
Mark Scheme
Max 3 marks
- Alternate monomers are upside down (rotated 180°) (1 mark)
- The monomers are joined by glycosidic bonds (1 mark)
- The chains are straight (unbranched) (1 mark)
- The bonds are 1–4 glycosidic bonds (1 mark)
- Both are made of β monomers (1 mark)
Also accepted / rejected
Not accepted
- Mentioning 1–6 bonds (cancels point 4)
- “Both are polysaccharides” or “both contain C, H and O” (no mark)
Tips
- Use features shown in Figure 1: β monomers, glycosidic (1–4) bonds, unbranched chains, and alternate monomers flipped
- Say “monomer”, not “molecule”
- Don’t mention 1–6 bonds (that’s starch), which cancels the 1–4 mark
- Hydrogen bonds between chains aren’t shown in the figure, so don’t include them
Honey contains glucose, fructose and a small amount of sucrose.
A student tested a solution of honey for reducing sugars.
Describe how the student would test the honey solution for reducing sugars. Then give the result they would expect and explain why.
(3 marks) Revise this topic ↗
Hint
What reagent is used? What conditions are needed? What colour shows a positive result? Which sugars in the sample would actually react?
Mark Scheme
- Heat the sample with Benedict’s solution (1 mark)
- A red colour (or precipitate) (1 mark)
- Because glucose and fructose are reducing sugars (1 mark)
Also accepted / rejected
Also accepted
- Green, yellow, orange or brown for red (point 2)
Not accepted
- Heating with acid first (that is the test for non-reducing sugars)
- Saying sucrose is detected (point 3)
Tips
- Say “heat” with Benedict’s reagent; “use a water bath” on its own doesn’t show it is heated
- Don’t describe the non-reducing sugar test (e.g. boiling with acid)
- Explain the positive result: glucose and fructose are reducing sugars. Sucrose is a non-reducing sugar, so it isn’t detected
- Give one expected result (e.g. red); don’t list every possible colour
- Sucrose being present doesn’t stop the colour change, because glucose and fructose are still there
In the early 1900s, a group of scientists investigated enzyme action.
After studying their results, the scientists reached the following conclusions:
Enzymes speed up reactions at body temperature. They do this without binding to the substances that react. Enzymes are not used up or changed by the reactions they speed up.
Our current understanding of enzyme action is based on the induced-fit model.
Compare these early conclusions with our current understanding of enzyme action. Give similarities and differences.
(4 marks) Revise this topic ↗
Hint
Compare the early conclusions with the induced-fit model. What do both agree on about what enzymes do? What does the modern model say about the substrate and the active site that the early scientists denied?
Mark Scheme
Similarities
- Enzymes are not changed by the reaction, so they can be reused (1 mark)
- Enzymes speed up reactions at body temperature, or lower the activation energy (1 mark)
Differences
- In the induced-fit model, the active site changes shape (1 mark)
- The enzyme does combine with the substrate: an enzyme-substrate complex forms (1 mark)
Also accepted / rejected
Also accepted
- “The active site and substrate bind” or “E-S complex” (point 4)
Tips
- Say the active site changes shape when the substrate binds (induced fit); “the tertiary structure changes” is not precise enough
- Be specific about similarities: “both cause reactions” is too vague. Say both are unchanged by the reaction and allow reactions at normal temperatures
- Show understanding in your own words rather than copying phrases from the passage
- Use the word “substrate”, not “substance”
What earns marks
- Similarities are usually answered much better than differences
- Stating that an enzyme-substrate complex forms earns a difference mark
Figure 1 shows a glycerol molecule and a fatty acid. In a triglyceride, each fatty acid is joined to glycerol by a bond.
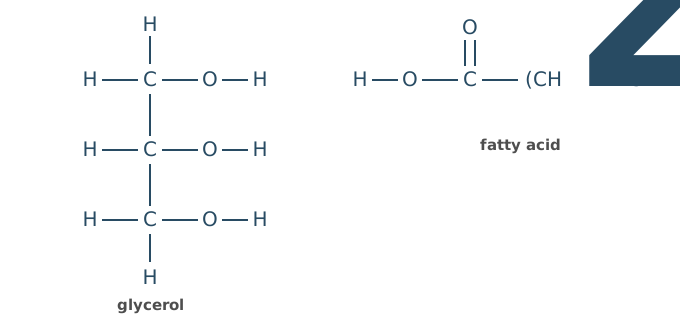
On Figure 1, draw a circle around the atoms that are removed from each molecule when this bond forms.
Name the bond, and the type of reaction that forms it.
(3 marks) Revise this topic ↗
Hint
What small molecule is released when glycerol and a fatty acid join? Which atoms from each molecule make up that molecule?
Mark Scheme
- Circle the H of one of glycerol’s OH groups and the OH of the fatty acid’s COOH group (these form water) (1 mark)
- An ester bond (1 mark)
- A condensation reaction (1 mark)
Also accepted / rejected
Also accepted
- Circling the OH from glycerol and the H from the fatty acid’s OH group (point 1)
Tips
- Name the bond as an ester bond, not a glycosidic bond
- Circle the OH of the fatty acid’s carboxyl group and the H of an OH group on glycerol; together they form the water that is removed
- Don’t circle an H from a C–H group of glycerol, and don’t circle an OH on both molecules
What earns marks
- Most students know the bond is formed by a condensation reaction
Phospholipids are one of the main components of the cell-surface membrane. There is water on both sides of the membrane (in the cytoplasm inside the cell, and in the fluid outside the cell).
Describe and explain how the phospholipid molecules are arranged in the membrane.
(2 marks) Revise this topic ↗
Hint
Think about which part of a phospholipid is attracted to water and which part is repelled by it, and how this makes the molecules arrange themselves with water on both sides of the membrane.
Mark Scheme
- The phospholipids form a bilayer in the cell-surface membrane (1 mark)
- This is because the hydrophilic phosphate heads are attracted to the water on both sides, so they face outwards, and the hydrophobic fatty acid tails are repelled by water, so they face inwards (1 mark)
Also accepted / rejected
Also accepted
- A correctly labelled diagram of a bilayer (point 1)
- Either half of point 2 on its own: heads attracted to water, or tails repelled by water
- “Polar” for hydrophilic and “non-polar” for hydrophobic
Tips
- Explain why a bilayer forms, not just that it is one: the phosphate heads are hydrophilic and point towards water, the fatty acid tails are hydrophobic and point away from it
- Double-check which part is which: heads hydrophilic, tails hydrophobic
- Stick to the arrangement; points about permeability or carrier proteins gain no marks
- If you draw a diagram, label it and show where the water is
What earns marks
- Identifying the phospholipid bilayer (the mark most students get)
The melting point is the temperature at which a solid changes into a liquid.
Table 1 shows information about four fatty acids.
Table 1
| Fatty acid | Number of carbon atoms | Number of C=C double bonds | Melting point / °C |
|---|---|---|---|
| A | 18 | 0 | 70 |
| B | 18 | 1 | 13 |
| C | 18 | 2 | −5 |
| D | 18 | 3 | −11 |
Describe the relationship shown in Table 1 between the structure of a fatty acid and its melting point.
(1 mark) Revise this topic ↗
Hint
Consider how double bonds affect the shape of fatty acid chains and how closely they can pack together.
Mark Scheme
As the number of C=C double bonds increases, the melting point decreases (1 mark)
Also accepted / rejected
Also accepted
- The opposite: the more saturated the fatty acid, the higher the melting point
- “As the number of hydrogen atoms increases, the melting point increases”
Tips
- Describe the link using carbon–carbon double bonds: as the number of double bonds increases, the melting point decreases
- If you mention hydrogen, refer to hydrogen atoms, not hydrogen molecules
- Read the question: it asks about melting point, not boiling point
Describe how a protein with a quaternary structure is formed from its monomers.
Do not describe transcription or translation.
(5 marks) Revise this topic ↗
Hint
Describe each level of protein structure and the bonds involved at each level.
Mark Scheme
- Amino acids are joined by peptide bonds (1 mark)
- In condensation reactions (1 mark)
- The secondary structure forms by hydrogen bonding (1 mark)
- The tertiary structure forms by interactions between R groups (1 mark)
- The quaternary structure has more than one polypeptide (held by bonds between them) (1 mark)
Also accepted / rejected
Also accepted
- “α-helix” or “β-pleated sheet” for secondary structure (point 3)
- Named interactions for points 4 and 5: hydrogen bonds, ionic bonds, disulfide bridges, hydrophobic interactions
Not accepted
- “Four polypeptides” for quaternary (it means more than one)
Tips
- Cover all levels of protein structure: primary (amino acids joined by peptide bonds via condensation), secondary, tertiary, quaternary
- Quaternary structure doesn’t always mean four polypeptides: it means more than one polypeptide chain
- Don’t forget to mention condensation reactions and peptide bonds for primary structure
During transcription, RNA polymerase joins free RNA nucleotides together to make a strand of mRNA.
Describe how the nucleotides are joined.
(2 marks) Revise this topic ↗
Hint
Think about the name of the bond formed between adjacent nucleotides and the type of reaction that forms it.
Mark Scheme
- A phosphodiester bond forms between adjacent nucleotides (1 mark)
- By a condensation reaction (1 mark)
Also accepted / rejected
Not accepted
- A bond between complementary bases (e.g. A and U); that is base pairing, not how the nucleotides in the strand are joined
Tips
- Name the phosphodiester bond and say it forms between the phosphate of one nucleotide and the ribose of the next, not between bases or between RNA and DNA
- Don’t confuse phosphodiester bonds with hydrogen bonds
- Answer the question asked: describing the rest of transcription gains no marks
What earns marks
- Stating the bond is formed by condensation (the mark most students get)
Describe what happens to the chromosomes during metaphase and during anaphase of mitosis.
(4 marks) Revise this topic ↗
Hint
For each stage, think about where the chromosomes are and what they are attached to. What happens at the centromeres to let the chromatids separate?
Mark Scheme
Max 2 marks for metaphase
Metaphase
- The chromosomes line up at the equator (middle) of the cell (1 mark)
- They are attached to the spindle fibres by their centromeres (1 mark)
- Each chromosome is fully condensed, made of two sister chromatids (1 mark)
Anaphase
- The centromeres divide (1 mark)
- The chromatids are pulled to opposite poles (1 mark)
Also accepted / rejected
Also accepted
- “Metaphase plate” for the equator (point 1)
- “Short and thick” for condensed (point 3)
Not accepted
- Homologous chromosomes moving to opposite poles (that’s meiosis)
Tips
- In metaphase, say where the chromosomes are (lined up at the equator) and what holds them there (spindle fibres attached at the centromeres)
- In anaphase, say the centromeres divide and the chromatids are pulled to opposite poles
- Don’t include meiosis events such as homologous chromosomes separating or crossing over
The Golgi apparatus is an organelle found in eukaryotic cells.
Describe two functions of the Golgi apparatus.
(2 marks) Revise this topic ↗
Hint
Give two DIFFERENT functions. Processing and packaging are related: consider what else the Golgi does.
Mark Scheme
Max 2 marks
- Modifies and packages proteins, e.g. adds carbohydrate to make glycoproteins (1 mark)
- Modifies and packages lipids, e.g. makes glycolipids (1 mark)
- Forms vesicles or lysosomes (1 mark)
Also accepted / rejected
Also accepted
- “Processes” for modifies, or “transports” (points 1 and 2)
- Makes or packages polysaccharides (not cellulose), as an extra point
Not accepted
- Two answers that describe the same function, e.g. “processes lipids” and “makes glycolipids”
Tips
- Give two different functions: e.g. modifying/packaging proteins, and forming vesicles or lysosomes
- “Processing lipids” and “producing glycolipids” are the same function, so they only score once
- The Golgi apparatus doesn’t make ribosomes
Cells in the pancreas make digestive enzymes and release them into the small intestine.
Describe the role of organelles in the production and release of these enzymes.
Do not include details of transcription in your answer.
(5 marks) Revise this topic ↗
Hint
Follow the pathway from gene to secreted enzyme. Which organelle is involved at each step? Don’t forget energy requirements.
Mark Scheme
Max 5 marks
- DNA in the nucleus codes for the enzyme (1 mark)
- Ribosomes on the rough endoplasmic reticulum make the enzyme (translation) (1 mark)
- The rough endoplasmic reticulum transports and modifies the enzyme (1 mark)
- Mitochondria make the ATP needed (1 mark)
- The Golgi apparatus modifies and packages the enzyme into vesicles (1 mark)
- Vesicles move to and fuse with the cell-surface membrane, releasing the enzyme (exocytosis) (1 mark)
Also accepted / rejected
Also accepted
- “Protein” or “polypeptide” instead of “enzyme” (all points)
- “Gene” or “genetic code” for DNA (point 1)
- “Golgi body” (point 5)
Not accepted
- Mitochondria “producing energy” (point 4)
Tips
- Focus on organelles: nucleus (DNA codes for the enzyme), ribosomes/rough ER (translation), rough ER (transport), Golgi apparatus (modifies and packages), vesicles fuse with the cell-surface membrane
- Include mitochondria producing ATP (not “producing energy”)
- Say vesicles fuse with the cell-surface membrane, not just take the enzyme “where it is needed”
- Don’t describe translation or protein structure in detail, or phagocytosis and DNA replication
What earns marks
- Ribosomes, packaging in the Golgi apparatus and exocytosis are the most common marks
Scientists investigated cells taken from the stomach wall of mice.
The stomach wall contains several different types of specialised cells.
Name the level of organisation made of specialised cells that are:
- all of one type
- of more than one type.
(1 mark) Revise this topic ↗
Hint
Think about the levels of organisation in a multicellular organism: what is a group of one type of specialised cell called, and what is a structure made of several types called?
Mark Scheme
A tissue (all one type) and an organ (more than one type) (1 mark, both needed, in this order)
Tips
- Cells of one type form a tissue; cells of more than one type form an organ. Give them in this order
- Don’t use terms such as unicellular, multicellular, organ system, genus or phylum
A doctor does not prescribe antibiotics to a patient with flu.
Give one reason why antibiotics don’t work against viruses.
(1 mark) Revise this topic ↗
Hint
Antibiotics target specific bacterial structures. What structures do bacteria have that viruses lack?
Mark Scheme
Viruses don’t have the structures or enzymes that antibiotics target, e.g. no cell wall (murein), or no metabolism of their own (1 mark)
Also accepted / rejected
Also accepted
- “No ribosomes” of their own
- A named process, e.g. they don’t make their own proteins
Not accepted
- “Viruses hide inside cells”
Tips
- Name what antibiotics target that viruses lack, e.g. a cell wall (murein) or bacterial enzymes
- “Viruses hide inside cells” is a GCSE-level answer that gains no mark
- Don’t confuse antibiotics with antibodies
An image from an optical microscope shows a single bacterial cell. In the image, the cell is 54 mm long.
The actual length of this bacterial cell is 1.8 µm.
Calculate the magnification of this image.
Show your working.
Magnification × ________
(2 marks) Revise this topic ↗
Hint
Use the magnification formula. Be very careful with unit conversions between mm and µm.
Mark Scheme
× 30 000 (2 marks)
Working: 54 mm = 54 000 µm; magnification = image size ÷ actual size = 54 000 ÷ 1.8 = 30 000
If the answer is wrong, 1 mark for any of:
- 54 000 µm (the image size in µm)
- ÷ 1.8 (dividing the image size by the actual size)
Also accepted / rejected
Also accepted
- Answers that round to 30 000
- Dividing 54 mm by 0.0018 mm
Tips
- Magnification = image size ÷ real size
- Convert units correctly: 54 mm = 54 000 µm, not 5400 µm
- Don’t divide the real size by the image size
Table 1 gives the resolution of three types of microscope.
Table 1
| Type of microscope | Resolution / µm |
|---|---|
| Optical (light) microscope | 0.2 |
| Scanning electron microscope (SEM) | 0.01 |
| Transmission electron microscope (TEM) | 0.0002 |
Table 2 gives the sizes of algal cells and mitochondria.
Table 2
| Structure | Diameter / µm |
|---|---|
| Algal cell | 8 to 12 |
| Mitochondrion | 0.5 to 1.0 |
For each investigation below, choose the most suitable microscope and give two reasons for your choice.
Use Table 1, Table 2 and your knowledge of microscopes.
Investigation 1 – looking at the living algal cells in a sample of pond water. A blue dye is added that only enters the dead cells.
Investigation 2 – seeing the three-dimensional surface shape of mitochondria.
(4 marks) Revise this topic ↗
Hint
Compare each microscope’s resolution with the size of what you need to see. Which microscope can view living cells and colour, and which one shows the 3-D surface of a structure?
Mark Scheme
Max 4 marks
Investigation 1: optical (light) microscope (no mark for the name; max 2 from points 1 to 3)
- It can be used to view living cells (1 mark)
- It shows colour, so the blue dead cells can be told apart (1 mark)
- Its resolution (0.2 µm) is enough to see the algal cells (1 mark)
Investigation 2: scanning electron microscope (SEM) (no mark for the name)
- Its resolution (0.01 µm) is high enough to see mitochondria (1 mark)
- It shows surfaces in three dimensions (1 mark)
Also accepted / rejected
Also accepted
- The opposite, e.g. “electron microscopes can’t show colour” (point 2)
- If points 4 and 5 aren’t given: 1 mark for choosing a TEM to see internal structures, or because it has the highest resolution
Not accepted
- Points 1 to 3 given for any microscope other than an optical microscope
Tips
- Don’t mix up SEM and TEM: an SEM gives 3-D images of surfaces; a TEM gives 2-D images of internal structures
- Use resolution correctly: a smaller value means a higher resolution, so an SEM (0.01 µm) has a higher resolution than an optical microscope (0.2 µm)
- Points about ease of use or specimen preparation gain no marks; give reasons linked to living cells, colour, resolution and 3-D structure
What earns marks
- Choosing an optical microscope for investigation 1, because it can view living cells and show the colour of the stain
A scientist wants a pure sample of nuclei from liver tissue.
Describe and explain how the scientist could use cell fractionation and ultracentrifugation to obtain this sample.
(6 marks) Revise this topic ↗
Hint
Think about why each property of the solution matters (cold, isotonic, buffered). For centrifugation, which organelles settle first and why?
Mark Scheme
Max 6 marks
- Homogenise the tissue to break open the cells and release the organelles (1 mark)
- Filter to remove whole cells and debris (1 mark)
- Use a cold solution to reduce enzyme activity (1 mark)
- Use an isotonic solution (same water potential) so the organelles don’t burst or shrink by osmosis (1 mark)
- Use a buffered solution so proteins don’t denature (1 mark)
- Centrifuge at a low speed, so the nuclei form the pellet (1 mark)
Also accepted / rejected
Also accepted
- “Blend”, “grind” or “chop” for homogenise (point 1)
- Up to 1000 × gravity as a low speed (point 6)
Not accepted
- Saying the solution stops cells bursting (point 4: it’s the organelles)
Tips
- Homogenise to break open the cells, then filter; don’t describe this as “fractionation”, and animal cells have no cell walls
- Explain each feature of the solution: cold to reduce enzyme activity; isotonic to stop organelles (not cells) bursting or shrinking; buffered to stop enzymes/proteins denaturing
- Nuclei are the densest organelles, so centrifuge at a low speed and they form the pellet
- Don’t describe increasing speeds or very high speeds to get the nuclei
What earns marks
- Homogenising and filtering are well known
Zika is a disease caused by the Zika virus.
Scientists designed a test to detect antibodies against the Zika virus in a patient’s blood sample. Figure 1 shows how the test works, and the negative and positive results.
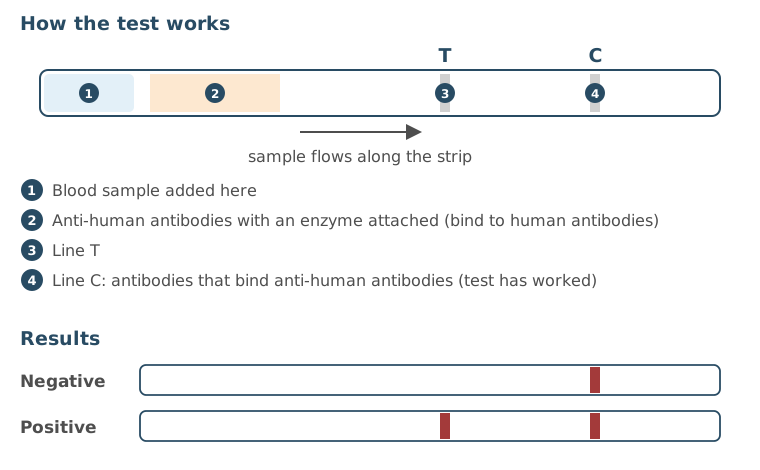
Suggest what is on the test at line T, and explain what causes the line to appear in a positive test.
(2 marks) Revise this topic ↗
Hint
Read the question carefully: what is being detected, antibodies or antigens? Describe how the ELISA technique produces a visible result.
Mark Scheme
- Line T has Zika antigen (with the enzyme’s substrate) (1 mark)
- In a positive test, the enzyme on the anti-human antibody reacts with the substrate, forming enzyme-substrate complexes that give the colour (1 mark)
Also accepted / rejected
Also accepted
- “A colourless dye” for substrate (point 2)
Not accepted
- Antigen in the patient’s blood (point 1: the test detects antibodies)
Tips
- The test detects Zika antibodies in the blood, so line T holds Zika antigen (and substrate); it doesn’t detect the virus or antigen in the blood
- The line appears because the enzyme on the anti-human antibody reacts with the substrate, giving a colour change; say “enzyme”, not just a dye or beads
Some structures are found in some prokaryotic cells but not in all of them.
Name three of these structures.
(2 marks) Revise this topic ↗
Hint
Every prokaryotic cell has a cell-surface membrane, cell wall, 70S ribosomes and circular DNA. Which other structures are found in only some of them?
Mark Scheme
Capsule, plasmids and flagella (2 marks)
All three correct = 2 marks; two correct = 1 mark
Also accepted / rejected
Also accepted
- Pili, or photosynthetic membranes (lamellae)
Tips
- Don’t give viral structures: a capsid belongs to a virus; the prokaryotic structure is a capsule
- Don’t give 70S ribosomes: they are found in all prokaryotic cells
- Don’t give organelles that are only found in eukaryotic cells, such as mitochondria or a nucleus
- Spell key terms correctly, e.g. pili
What earns marks
- Capsule, plasmids and flagella are the most common correct answers
Virus particles share some structural features.
Name three of these features, and describe the function of one of them.
(2 marks) Revise this topic ↗
Hint
Which features do virus particles share? What contains the genetic material, what surrounds it, and what helps the virus attach to host cells?
Mark Scheme
- Genetic material (DNA or RNA), a capsid and attachment proteins (1 mark)
- One correct function (1 mark), e.g.
- the genetic material codes for viral proteins
- the capsid protects the genetic material
- attachment proteins bind to receptors on the host cell
Also accepted / rejected
Also accepted
- “Nucleic acid” or “genome” for genetic material (point 1)
- “Glycoprotein” for attachment protein
- A correct function of a wrong feature still earns point 2, e.g. reverse transcriptase makes DNA from RNA
Not accepted
- “DNA and RNA” (point 1: a virus has one or the other)
Tips
- Give the three shared features: genetic material (DNA or RNA), capsid and attachment proteins
- Some viruses have DNA and others RNA, so write “DNA or RNA”, not that all viruses have one of them
- Don’t give features only some viruses have (reverse transcriptase, lipid envelope) or bacterial structures (capsule, plasmid, flagella)
- For attachment proteins, say they bind to receptors on the host cell
Hint
Acellular means ‘not made of cells’. What would a cell have that a virus lacks? Think about organelles and cytoplasm.
Mark Scheme
- Acellular: they are not made of cells; they have no cell-surface membrane (1 mark)
- Non-living: they have no metabolism; they can’t replicate on their own (only inside a host cell) (1 mark)
Also accepted / rejected
Also accepted
- No cytoplasm or no organelles (point 1)
- They can’t respire, move or excrete on their own (point 2)
Not accepted
- “No membrane-bound organelles” (point 1: prokaryotic cells don’t have these either)
Tips
- Acellular means not made of cells: no cell-surface membrane, cytoplasm or organelles
- Don’t define acellular using non-living features (e.g. “can’t reproduce on their own”), or as “smaller than a cell” or “unicellular”
- Non-living: they have no metabolism and can’t replicate or respire independently
- “No mitochondria” isn’t a reason: prokaryotic cells lack mitochondria but are alive
What earns marks
- Explaining non-living as being unable to replicate without a host cell
Some molecules cross cell-surface membranes by facilitated diffusion. Others cross by active transport.
Describe each of these processes.
(3 marks) Revise this topic ↗
Hint
Consider: What types of molecules need help crossing? What direction relative to the gradient? What provides the energy (if any)? What type of protein is involved in each?
Mark Scheme
- Both move polar or charged molecules or ions that can’t pass through the phospholipid bilayer (1 mark)
- Facilitated diffusion: movement down a concentration gradient through a carrier or channel protein (1 mark)
- Active transport: movement against a concentration gradient through a carrier protein, using ATP (1 mark)
Also accepted / rejected
Also accepted
- A named polar molecule or ion, e.g. glucose or Na⁺ (point 1)
Not accepted
- ATP being used in facilitated diffusion (point 2)
- A channel protein in active transport (point 3)
Tips
- Say facilitated diffusion uses channel or carrier proteins; “transport proteins” or “proteins” is too vague
- Say active transport uses carrier proteins (not channel proteins) and ATP
- Facilitated diffusion is passive: it does not use ATP
- Describe movement down or against a concentration gradient, not “along” or “with” it
- Mention that these processes move polar or charged molecules (e.g. ions)
A scientist set up the apparatus in Figure 1 to investigate osmosis.
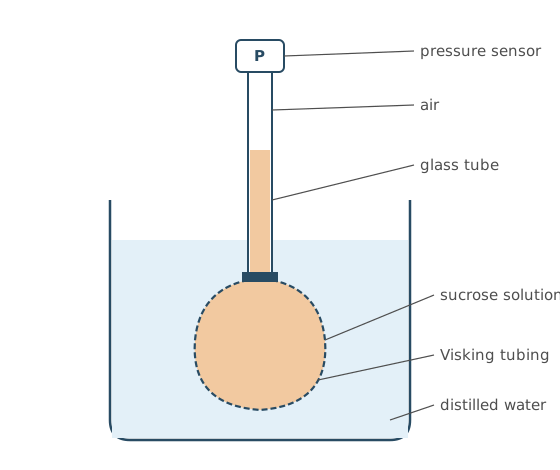
After an hour, the air pressure in the tube had increased.
Use your knowledge of osmosis to explain why.
(3 marks) Revise this topic ↗
Hint
Compare the water potential of the two solutions. What type of membrane separates them? Where will water move, and what effect will this have on the volume inside?
Mark Scheme
- The sucrose solution has a lower water potential than the water in the beaker (1 mark)
- So water moves into the bag by osmosis, across the partially permeable Visking tubing (1 mark)
- The volume of solution increases, squashing the air into a smaller volume (1 mark)
Also accepted / rejected
Also accepted
- “More negative water potential” (point 1)
- “Selectively permeable” or “semi-permeable” (point 2)
Tips
- Use water potential, not “water concentration”: the sucrose solution has a lower water potential than the water
- Name the Visking tubing as the partially permeable membrane and give the direction water moves (into the sucrose solution)
- Say what changes: the volume of the sucrose solution increases, so the volume of air decreases
- Apply osmosis to this apparatus rather than just giving a definition
Rotavirus infects the epithelial cells lining the ileum of young children. The infected cells lose their microvilli. As a result, the children absorb fewer products of digestion and less water, and they develop diarrhoea.
Explain why losing microvilli reduces the absorption of the products of digestion, and why this then reduces the absorption of water.
(3 marks) Revise this topic ↗
Hint
What do microvilli provide for absorption? If more products of digestion stay in the ileum, what happens to the water potential there?
Mark Scheme
Products of digestion
- A smaller surface area, or fewer carrier (co-transport) proteins (1 mark)
Water
Normally, water follows the absorbed products of digestion into the cells by osmosis.
- More products of digestion stay in the lumen, so the water potential in the lumen stays lower than normal (1 mark)
- So there is a smaller water potential gradient, and less water moves from the lumen into the cells by osmosis (1 mark)
Also accepted / rejected
Also accepted
- Fewer channel proteins (point 1)
- The water potential in the cells is higher, or the water potential gradient is smaller (point 2)
- Water moves out of the cells into the ileum by osmosis (point 3)
Not accepted
- “SA” or “WP” written as abbreviations
Tips
- Losing microvilli means a smaller surface area and fewer carrier proteins, so fewer products of digestion are absorbed
- Water moves by osmosis, not diffusion; the unabsorbed products lower the water potential in the ileum
- Give the direction: less water moves out of the ileum into the cells
A grasshopper has a tracheal system. Air enters through spiracles and moves along tubes to the respiring tissues.
Name one adaptation of the gas exchange surface in this system, and explain its importance.
(2 marks) Revise this topic ↗
Hint
Where does gas exchange actually happen in an insect: the spiracles, the tracheae or the tracheoles? Pick one feature of that surface and link it to diffusion.
Mark Scheme
Max 2 marks: one adaptation and why it matters
Either
- The tracheole walls are thin (one cell thick) (1 mark)
- So there is a short diffusion pathway and rapid diffusion into the cells (1 mark)
Or
- Tracheoles reach right into the tissues, next to the muscle fibres (1 mark)
- So gases diffuse directly into the cells, over a short diffusion pathway (1 mark)
Or
- The tracheoles are highly branched (1 mark)
- So there is a large surface area for rapid diffusion, or a short diffusion pathway (1 mark)
Also accepted / rejected
Also accepted
- “Touch” or “are close to” the cells for “reach into” (point 3)
- “Very many tracheoles” for highly branched (point 5)
Not accepted
- Features of the spiracles or tracheae; the tracheoles are the gas exchange surface
Tips
- The gas exchange surface is the tracheoles, so describe a feature of the tracheoles, not the spiracles
- Link the feature to diffusion, not just “gas exchange”, e.g. highly branched tracheoles give a large surface area for rapid diffusion
- Fluid moving out of the tracheoles, and saving water, aren’t features of the gas exchange surface
Leaves take in carbon dioxide for photosynthesis and release oxygen.
Describe and explain how the structure of a leaf is adapted for efficient gas exchange.
Do not refer to organelles in your answer.
(4 marks) Revise this topic ↗
Hint
Follow the route gases take between the air and the cells inside a leaf, and link each adaptation to faster diffusion.
Mark Scheme
Max 4 marks
- Many stomata (1 mark)
- Stomata allow gases to diffuse in and out (1 mark)
- Air spaces in the mesophyll (1 mark)
- Mesophyll cells have a large surface area for diffusion (1 mark)
- Leaves have a large surface area to volume ratio, so diffusion is faster (1 mark)
- Leaves are thin, giving a short diffusion pathway (1 mark)
Tips
- Say there are many stomata, and that they allow gases to diffuse in and out
- Link every adaptation to diffusion; “for gas exchange” on its own isn’t enough
- Describe the large surface area of the mesophyll cells (their membranes), not just the large surface area of the whole leaf
- The short diffusion pathway comes from the leaf being thin, not from thin membranes or the leaf being flat
- Stick to the question: xerophytic adaptations, the waxy cuticle, guard cells opening and closing, or light absorption gain no marks
- Use the right term: stomata, not “stroma” or “spiracles”
Ventilation keeps a steep oxygen concentration gradient between the air in the alveoli and the blood.
Describe how we breathe in.
(3 marks) Revise this topic ↗
Hint
Which muscles contract, and what does each one move? How do these movements change the volume and pressure inside the chest?
Mark Scheme
- The diaphragm contracts and flattens (moves down) (1 mark)
- The external intercostal muscles contract, pulling the ribs up and out (1 mark)
- The volume of the thoracic cavity increases, so the pressure decreases (1 mark)
Also accepted / rejected
Also accepted
- “Thorax” or “lungs” instead of “thoracic cavity” (point 3)
Tips
- The diaphragm contracts and flattens; the external intercostal muscles contract and pull the ribs up and out
- The intercostal muscles move the ribs, not the diaphragm
- Then say what this does: the volume of the thoracic cavity increases and the pressure decreases
- Say “thoracic cavity”, not “chest”
- The route air takes through the airways gains no marks
Some chemicals, such as nitrites, change the iron in some haemoglobin molecules so that they can no longer bind oxygen.
Figure 1 shows the dissociation curve for oxyhaemoglobin:
- with no nitrite exposure
- after nitrite exposure, when 40% of the haemoglobin can no longer bind oxygen.
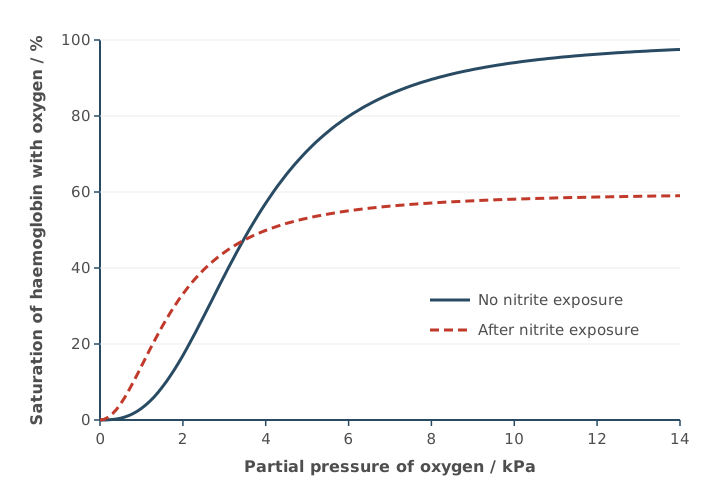
Using Figure 1, what can you conclude about how exposure to nitrites affects the loading and unloading of oxygen by haemoglobin?
Explain your answer.
(3 marks) Revise this topic ↗
Hint
Compare the two curves at high pO₂ (in the lungs) and at low pO₂ (in respiring tissues). How much oxygen is loaded, and how readily is it unloaded?
Mark Scheme
Loading
- Less oxygen is loaded at high pO₂: the maximum saturation is only 60% (1 mark)
Unloading
- At low pO₂, haemoglobin has a higher affinity for oxygen (1 mark)
- So less oxygen is unloaded to respiring tissues at low pO₂ (1 mark)
Also accepted / rejected
Also accepted
- “In the lungs” for high pO₂ (point 1)
- “The curve levels off at 60%” (point 1)
- “In respiring cells” for low pO₂ (point 3)
Not accepted
- “More oxygen is loaded at low pO₂” (point 3: the point is that less is unloaded)
Tips
- Use the figure: after nitrite exposure, haemoglobin loads less oxygen at high pO₂ (maximum 60% saturation)
- At low pO₂ it has a higher affinity for oxygen, so it unloads less oxygen to respiring tissues
- Don’t say it “loads more readily at low pO₂”; the point is it unloads less
- The Bohr effect and pH aren’t relevant
Blood leaving a kidney is low in oxygen. Before it can supply oxygen to the heart muscle, it must pass through the lungs.
Describe the route taken by blood from a kidney to the coronary arteries.
Name the major blood vessels (arteries and veins) and the heart valves the blood passes through.
(5 marks) Revise this topic ↗
Hint
Start at the renal vein and follow the blood back to the heart, through the right side, to the lungs and back, through the left side, and out to the coronary arteries. Name every vessel and valve.
Mark Scheme
- Renal vein → vena cava → right atrium (1 mark)
- Through the atrioventricular valve into the right ventricle (1 mark)
- Through the semilunar valve into the pulmonary artery → lungs → pulmonary vein (1 mark)
- Left atrium → atrioventricular valve → left ventricle (1 mark)
- Through the semilunar valve into the aorta → coronary arteries (1 mark)
Also accepted / rejected
Also accepted
- “Tricuspid” (right) and “bicuspid” or “mitral” (left) for the atrioventricular valves
- “Pulmonary valve” and “aortic valve” for the semilunar valves
Not accepted
- “AV valve” written instead of atrioventricular valve (penalised once)
Tips
- Don’t stop at the lungs: continue through the left side of the heart and out to the coronary arteries
- Don’t mix up the pulmonary artery (heart to lungs) and the pulmonary vein (lungs to heart)
- Name the valves correctly: atrioventricular (tricuspid) on the right, atrioventricular (bicuspid) on the left, and a semilunar valve leaving each ventricle
- Write “atrioventricular valve” in full, not “AV valve”
The aorta carries blood at high pressure away from the left ventricle.
Describe two features of the aorta wall, and explain how each is related to the function of the aorta.
(2 marks) Revise this topic ↗
Hint
Name a tissue in the wall, then explain what it does as blood surges through with each heartbeat.
Mark Scheme
Max 2 marks
- Smooth muscle that can withstand the high pressure (1 mark)
- Elastic tissue that stretches and recoils, smoothing out the blood pressure (1 mark)
- A smooth endothelium that reduces friction (1 mark)
- Collagen (protein) that stops the wall splitting under high pressure (1 mark)
Also accepted / rejected
Also accepted
- “Expands” for stretches (point 2)
Not accepted
- “Contracts and relaxes” for recoils (point 2)
- “Thick wall” on its own, without naming the muscle
Tips
- Name a structure and link it to a function: smooth muscle withstands high pressure; elastic tissue stretches and recoils to smooth or maintain blood pressure
- Give both stretch and recoil
- Muscle in the aorta wall doesn’t pump blood
- The smooth endothelium (not epithelium) reduces friction
After a severe burn, the capillaries near the burn become leaky. Plasma proteins move out of the capillaries into the tissue fluid.
Explain how this affects the return of tissue fluid to the capillaries.
(2 marks) Revise this topic ↗
Hint
How do proteins in the tissue fluid change its water potential? Which way will water then move by osmosis?
Mark Scheme
- The proteins lower the water potential of the tissue fluid (1 mark)
- So less water returns to the capillaries by osmosis (1 mark)
Also accepted / rejected
Also accepted
- The water potential of the blood is higher than before, or the water potential gradient is smaller (point 1)
- “No water returns” (point 2)
Not accepted
- “WP” for water potential (point 1)
Tips
- Proteins in the tissue fluid lower its water potential, so say which way it changes and where
- It’s water that moves back by osmosis, not “tissue fluid”
- Give the direction: less water returns to the capillaries
In a tall tree, water moves up the xylem from the roots to the leaves. Xylem vessels have no end walls, so they form a continuous tube.
Explain why it is important for water transport that the xylem forms a continuous tube.
(3 marks) Revise this topic ↗
Hint
Think of cohesion-tension. What has to be unbroken for water to be pulled up? What holds the water molecules together, and what creates the pull?
Mark Scheme
- There is an unbroken column of water, with no barrier to water movement (1 mark)
- Cohesion: hydrogen bonds between water molecules hold the column together (1 mark)
- Evaporation (transpiration) from the leaves creates tension that pulls the column up (1 mark)
Also accepted / rejected
Also accepted
- “A continuous stream of water” (point 1)
- Water moving out of the xylem into leaf cells creates tension (point 3)
- If none of points 1 to 3 is given, 1 mark for “cohesion-tension moves water up the xylem”
Not accepted
- “A chain of water molecules” on its own (point 1)
Tips
- Give all three parts of cohesion-tension: an unbroken water column, cohesion from hydrogen bonds between water molecules, and tension created by transpiration
- Explain how the tension is created (by evaporation from the leaves); this part is often missed
- Don’t bring in translocation, sources and sinks, or sugars; the xylem carries water
In the nucleus of a eukaryotic cell, DNA is found in chromosomes.
Describe the structure of a DNA molecule, and how DNA is arranged in a chromosome.
(6 marks) Revise this topic ↗
Hint
Start with the monomer and how the monomers join. How are the two strands held together? Then: what is DNA wrapped around, and what does a chromosome look like before it divides?
Mark Scheme
Max 6 marks
DNA
- DNA is a polymer of nucleotides (1 mark)
- Each nucleotide has deoxyribose, a phosphate group and a nitrogenous base (1 mark)
- Nucleotides are joined by phosphodiester bonds (1 mark)
- Two strands form a double helix, held together by hydrogen bonds (1 mark)
- Adenine pairs with thymine, and cytosine pairs with guanine (1 mark)
Chromosome
- The DNA is associated with histones (proteins) (1 mark)
- When visible during cell division, a chromosome has two chromatids joined at a centromere (1 mark)
Also accepted / rejected
Also accepted
- “Polynucleotide” (point 1)
- A correctly labelled diagram
Not accepted
- Bases given as letters only (A, T, C, G) (point 5)
- “Adenosine” or “cysteine” for adenine or cytosine
Tips
- Start with DNA being a polymer of nucleotides; this is often left out
- Write the base names in full (adenine, thymine, cytosine, guanine); letters alone gain no marks
- Say where the phosphodiester bonds are: between nucleotides
- For the chromosome: DNA associated with histones, and two chromatids joined at a centromere
Scientists studying a bacterium sequenced its genome and then identified its proteome.
Define the terms genome and proteome.
(2 marks) Revise this topic ↗
Hint
One term is about the DNA, the other about the proteins. Is it everything in one cell, or everything in a species?
Mark Scheme
- Genome: the complete set of genes (all the DNA) in a cell (1 mark)
- Proteome: the full range of proteins that a cell is able to produce (that its DNA codes for) (1 mark)
Also accepted / rejected
Also accepted
- “Organism” for cell (points 1 and 2)
- All the genetic material in a cell (point 1)
Not accepted
- All the DNA in a species or population (point 1)
- “The number of proteins” or “all the proteins in a cell” (point 2: it’s the range it can make)
Tips
- Genome: the complete set of genes (all the DNA) in a cell; “genetic information” or “the genetic code” is too vague
- Proteome: the full range of proteins a cell can produce; “all the proteins in a cell” isn’t enough
- Define both for a cell or organism, not a species or population
mRNA and tRNA are both types of RNA involved in protein synthesis.
Give three ways in which the structure of an mRNA molecule is different from the structure of a tRNA molecule.
| mRNA | tRNA | |
|---|---|---|
| 1 | ||
| 2 | ||
| 3 |
(3 marks) Revise this topic ↗
Hint
Think about the overall shape, relative length, and special features each type has for its function. Make sure you compare like with like.
Mark Scheme
Any three rows, each comparing the same feature (3 marks)
| mRNA | tRNA | |
|---|---|---|
| 1. | Has codons | Has an anticodon |
| 2. | No hydrogen bonds (no base pairing) | Hydrogen bonds between some bases |
| 3. | No amino acid binding site | Has an amino acid binding site |
| 4. | Linear (straight) | Clover-leaf shape (folded) |
| 5. | Long (many nucleotides) | Short (few nucleotides) |
Also accepted / rejected
Not accepted
- A row that doesn’t compare the same feature, e.g. “mRNA has codons, tRNA is folded”
Tips
- Compare the same feature on each row, e.g. mRNA is linear/straight while tRNA is clover-leaf shaped
- mRNA and tRNA both contain uracil and are both single-stranded; neither is a double helix, and tRNA doesn’t contain exons
- Say tRNA has an amino acid binding site, not just “has an amino acid”
- mRNA is longer than tRNA, not shorter
- “mRNA has codons but tRNA doesn’t” isn’t a valid comparison: tRNA has an anticodon
Cells in the pancreas make large amounts of the protein insulin. After transcription, the insulin mRNA leaves the nucleus.
Describe how the insulin polypeptide is made from this mRNA. In your answer, include the roles of ribosomes, tRNA and ATP.
(6 marks) Revise this topic ↗
Hint
Work through translation in order: where the ribosome attaches and how much of the mRNA it covers, what tRNA brings and how it pairs with the mRNA, and the two places where ATP is used.
Mark Scheme
Max 6 marks
- The ribosome attaches to the mRNA (1 mark)
- The ribosome covers two codons at a time, starting at the start codon (AUG) (1 mark)
- ATP provides energy to attach amino acids to tRNA (1 mark)
- tRNA brings a specific amino acid to the ribosome (1 mark)
- tRNA anticodons bind to complementary mRNA codons (1 mark)
- ATP provides energy to form peptide bonds (1 mark)
- The ribosome moves along the mRNA to the stop codon, forming the insulin polypeptide (1 mark)
Also accepted / rejected
Also accepted
- “Binds” or “joins” instead of “attaches” (point 1)
- “Rough endoplasmic reticulum” for the ribosome (point 1)
Tips
- Include both roles of ATP: attaching amino acids to tRNA, and forming peptide bonds. The first is often missed
- Say the ribosome covers two codons at a time
- For codon–anticodon pairing, use both key words: tRNA anticodons bind to complementary mRNA codons
- Describe the ribosome moving along the mRNA, forming a polypeptide, until it reaches a stop codon
What earns marks
- Answers set out in a logical sequence, including the ribosome attaching at the start codon
Table 1 shows some mRNA codons and the amino acid coded for by each codon.
Table 1
| mRNA codon | Amino acid |
|---|---|
| ACC | Thr |
| AUG | Met |
| CAU | His |
| CCU | Pro |
| GGA | Gly |
| GUA | Val |
| UAC | Tyr |
| UGG | Trp |
Figure 1 shows the mRNA base sequence produced when part of a gene coding for a protein is transcribed.
Figure 1
| CAU | GGA | UGG |
|---|
Use Table 1 to work out the sequence of amino acids coded for by the mRNA in Figure 1.
(1 mark) Revise this topic ↗
Hint
Use the mRNA codons directly with the table; don’t convert them to anything else first. Read each three-base sequence carefully.
Mark Scheme
His, Gly, Trp (in this order) (1 mark)
Tips
- Use the mRNA codons in Figure 1 directly (CAU, GGA, UGG): His, Gly, Trp
- Don’t use the complementary sequence (that gives Val, Pro, Thr)
Myxomatosis is a disease of rabbits caused by the myxoma virus. The virus was released in Australia in 1950 and killed most of the wild rabbits. Today, most wild rabbits in Australia are resistant to myxomatosis.
Use your knowledge of natural selection to explain why resistance is now so common in these rabbits.
(4 marks) Revise this topic ↗
Hint
Where did the resistance come from in the first place? Which rabbits survived the disease, and what did they pass on?
Mark Scheme
- A mutation produced a resistance allele (1 mark)
- Rabbits with this allele survived myxomatosis (were less likely to die from it) (1 mark)
- So they reproduced and passed on the allele (1 mark)
- Over many generations, the frequency of the allele increased (1 mark)
Also accepted / rejected
Also accepted
- The opposite for point 2, e.g. rabbits without the allele died of myxomatosis
- “The allele became more common” or “a higher proportion had the allele” (point 4)
Not accepted
- “Gene” for allele (penalised once)
- The virus causing the mutation (point 1)
- “The number of alleles increased” (point 4: it’s the frequency)
Tips
- Use the context: a mutation in the rabbits (not in the virus) produced a resistance allele, and rabbits with it survived myxomatosis
- Say “allele”, not “gene” or “trait”
- Finish the chain: they reproduce and pass on the allele, so over generations the allele frequency increases
- This is resistance, not immunity, so don’t describe an immune response
Strains of bacteria with antibiotic resistance are common on farms where large numbers of pigs are kept close together.
Use your knowledge of selection to explain why.
(3 marks) Revise this topic ↗
Hint
Think about why antibiotic use on these farms acts as a selection pressure, which bacteria survive, and what happens to the frequency of the resistance allele over generations.
Mark Scheme
- Antibiotics are used often on these farms, so the bacteria are regularly exposed to them (a selection pressure) (1 mark)
- Bacteria with the resistance allele survive, reproduce and pass on the allele (1 mark)
- So the frequency of the resistance allele increases (1 mark)
Also accepted / rejected
Also accepted
- Instead of point 1: resistant bacteria spread easily between pigs that are kept close together
- “Divide” or “binary fission” instead of “reproduce”
Not accepted
- “Gene” instead of “allele”, or “immunity” instead of “resistance”
Tips
- Link it to the farms: antibiotics are used a lot there, or resistant bacteria spread easily between pigs kept close together
- Say that bacteria with the resistance allele survive, reproduce and pass on the allele
- Finish with the result: the frequency of the resistance allele increases
- Use “allele”, not “gene”, and “resistance”, not “immunity”
- This is about antibiotics, not vaccines
A student tested whether clove oil kills bacteria. She used a pipette to transfer 0.1 cm³ of a bacterial culture from a bottle onto an agar plate. She then spread the culture over the agar with a spreader.
Describe the aseptic techniques the student should use.
(3 marks) Revise this topic ↗
Hint
Go through her steps one by one: her hands and bench, the pipette, the bottle, the agar plate and the spreader. How does she stop other microorganisms getting in at each step?
Mark Scheme
Max 3 marks
- Disinfect the bench (or wash hands) (1 mark)
- Use a sterile pipette (1 mark)
- Flame the neck of the bottle after removing the lid (1 mark)
- Lift the lid of the agar plate only slightly (at an angle) (1 mark)
- Work near a Bunsen flame, where air moves upwards (1 mark)
- Use a sterile spreader (1 mark)
- Put the used pipette and spreader into disinfectant straight away (1 mark)
Also accepted / rejected
Also accepted
- Antiseptic or alcohol wipes (point 1)
- A pipette from an unopened pack (point 2)
- Flaming the spreader, or dipping it in alcohol and then flaming it (point 6)
Not accepted
- An inoculating loop to transfer the culture (point 2)
- “The flame sterilises the air” (point 5: the rising air carries microbes away)
Tips
- Describe steps that fit this practical: disinfect the bench, sterile pipette, flame the neck of the bottle, lift the lid at an angle, sterile spreader
- Use a pipette, not a loop, to transfer a measured volume
- Don’t flame the lid or the agar; upward air currents carry microbes away, they don’t kill them
- Gloves, working quickly or closing windows gain no marks
A student investigated whether clove oil kills bacteria. She spread five different bacterial cultures on separate agar plates.
On each plate she placed three paper discs: one soaked in clove oil diluted with olive oil, one for a positive control and one for a negative control. She kept the plates at 25 °C for 48 hours, then measured the diameter of the clear zone with no bacterial growth around each disc.
Figure 1 shows one of her plates after 48 hours.
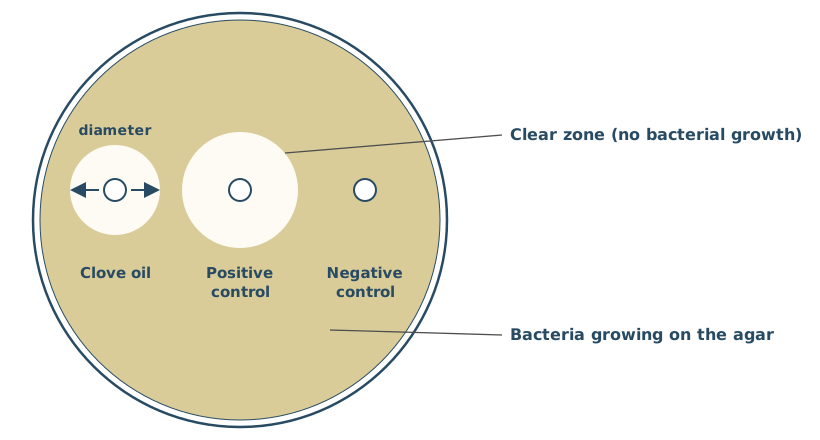
Suggest exactly what the student soaked the discs in to get the positive control and negative control results.
(2 marks) Revise this topic ↗
Hint
A positive control should give a known positive result. A negative control should give a known negative result. What would you soak each disc in?
Mark Scheme
Positive control
- A known antibacterial substance, e.g. an antibiotic or a disinfectant (1 mark)
Negative control
- Olive oil without clove oil, or sterile water (1 mark)
Also accepted / rejected
Also accepted
- A named antibiotic, antiseptic or disinfectant (point 1)
- If the answer isn’t labelled, the first substance counts as the positive control
Tips
- Positive control: a known antimicrobial (e.g. an antibiotic or disinfectant)
- Negative control: sterile water or olive oil without clove oil; “do nothing to the disc” or “add bacteria” is wrong
- Don’t swap them, and antibodies aren’t a positive control
Body cells of a female fruit fly, Drosophila melanogaster, contain 8 chromosomes.
Figure 1 shows the appearance of these 8 chromosomes just as a cell enters meiosis.
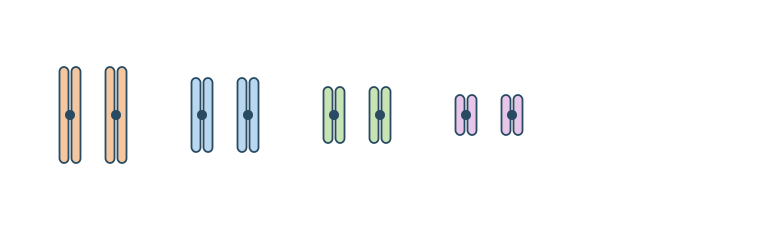
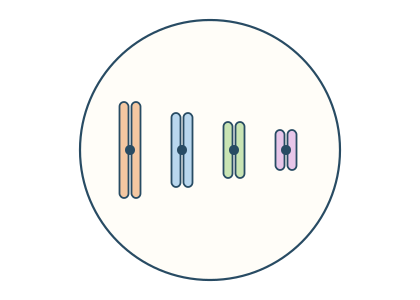
Using the information in Figure 1, draw the chromosomes as they would appear in one cell at the end of the first meiotic division.
(1 mark) Revise this topic ↗
Hint
The first meiotic division separates homologous pairs. How many of these eight chromosomes end up in each cell, and are they still made of two chromatids?
Mark Scheme
Four chromosomes, one from each pair, so each is a different size, and each still made of two chromatids, drawn in any order (1 mark)
For example,
Tips
- Draw 4 chromosomes, one from each homologous pair, so each one is a different size
- Each chromosome still has two chromatids at the end of the first meiotic division
- Don’t draw 8 single chromatids (the result of mitosis), 8 chromosomes with two chromatids (no halving) or 4 single chromatids (the result of the second division)
New alleles arise by mutation, which increases genetic variation within a species.
Describe and explain the other processes that increase genetic variation within a species.
(4 marks) Revise this topic ↗
Hint
Think about what happens to homologous chromosomes during meiosis, and what happens when gametes meet.
Mark Scheme
- Independent segregation of homologous chromosomes (in meiosis) (1 mark)
- Crossing over between homologous chromosomes (1 mark)
- Random fertilisation of gametes (1 mark)
- These produce new combinations of alleles (1 mark)
Also accepted / rejected
Also accepted
- “Random” for independent, and “assortment” for segregation (point 1)
- “Random fusion of gametes” (point 3)
- New combinations of maternal and paternal chromosomes, as an extra point
- If no other marks: 1 mark for “meiosis produces genetically different cells”
Not accepted
- “Random mating” (point 3)
Tips
- Say crossing over happens between homologous chromosomes, and independent segregation is of homologous pairs
- Finish by saying these produce new combinations of alleles
- Say fertilisation of gametes is random, not just “fertilisation is random”
- Migration and natural selection change allele frequencies but don’t create new combinations; non-disjunction is a mutation, which the question excludes
A student investigated whether clove oil kills bacteria. She spread five different bacterial cultures on separate agar plates.
On each plate she placed a paper disc soaked in clove oil and a paper disc soaked in a positive control. She measured the diameter of the clear zone with no bacterial growth around each disc, to the nearest whole mm.
Table 1 shows her results.
Table 1
| Bacterial culture | Diameter of clear zone with clove oil / mm | Diameter of clear zone with positive control / mm |
|---|---|---|
| Escherichia coli | 14 | 18 |
| Staphylococcus aureus | 19 | 22 |
| Bacillus subtilis | 16 | 20 |
| Pseudomonas fluorescens | 11 | 15 |
| Micrococcus luteus | 15 | 20 |
| Mean for all cultures | 15 | 19 |
| Standard deviation for all cultures | 2.9 | 2.6 |
The mean ± 2 standard deviations includes over 95% of the data.
Use this information to consider whether the standard deviations suggest the difference in means is likely to be due to chance.
Explain your answer, including at least one calculation.
(2 marks) Revise this topic ↗
Hint
Use mean ± 2 SD to find a range for each column. Do the two ranges overlap, and what does that suggest about the difference between the means?
Mark Scheme
- Mean ± 2 SD: clove oil 9.2 to 20.8 mm and positive control 13.8 to 24.2 mm (1 mark)
- The ranges overlap, so the difference in means is likely to be due to chance (not significant) (1 mark)
Also accepted / rejected
Also accepted
- Using mean ± 1.96 SD: 9.3 to 20.7 and 13.9 to 24.1 (point 1)
Not accepted
- “The results are due to chance” (point 2: it’s the difference in means)
- “The results are significant”
Tips
- The table gives one SD, so double it: 15 ± 5.8 = 9.2 to 20.8, and 19 ± 5.2 = 13.8 to 24.2
- The ranges overlap, so the difference in means is likely due to chance (not significant)
- Talk about the “difference”, not “the results”, being due to chance
Courtship behaviour in the three-spined stickleback, Gasterosteus aculeatus, involves male fish:
- performing a zigzag dance to attract sexually active females
- leading a female to his nest to start mating
- chasing females away when the male is not sexually active.
Scientists investigated stickleback courtship behaviour by feeding a population of sexually active male sticklebacks a diet containing bisphenol A (BPA), a chemical that acts like the hormone oestrogen. The scientists also fed a separate control population of sexually active males a diet without BPA.
They determined the percentage of males performing zigzag dances or chasing females away in each population.
Table 1
| Population | Percentage of males performing zigzag dances | Percentage of males chasing females away |
|---|---|---|
| Males fed BPA | 62 | 18 |
| Males not fed BPA (control) | 91 | 3 |
The scientists also investigated the effect on female courtship behaviour of feeding BPA to the males.
Table 2
| Population | Median time females spent in courtship / s |
|---|---|
| Males fed BPA | 41 |
| Males not fed BPA (control) | 95 |
BPA is used to make some plastics. Some BPA leaks into rivers from landfill sites and wastewater.
Suggest and explain the effect BPA pollution in rivers will have on stickleback breeding.
Use information from Table 1 and Table 2 in your answer.
(4 marks) Revise this topic ↗
Hint
Use BOTH tables. For each behaviour that changes, think about its function: what does that change mean for breeding success?
Mark Scheme
Max 4 marks
Effect on breeding
- Less mating, so fewer offspring (1 mark)
Explanation (max 3 from points 2 to 5)
- Fewer zigzag dances, so fewer females are attracted (1 mark)
- Fewer males lead females to the nest, because fewer are sexually active (1 mark)
- More chasing females away, because more males are not sexually active (1 mark)
- Females spend less time in courtship (1 mark)
Also accepted / rejected
Also accepted
- “Mature” instead of “sexually active” (point 4)
Tips
- Give the effect first: less mating/breeding, so fewer offspring
- Link each piece of data to its meaning: fewer zigzag dances so fewer females attracted; more chasing females away so more males not sexually active
- Use Table 2 correctly: females spent less time in courtship, not “fewer females”
- Use both tables; don’t just quote figures or describe trends
What earns marks
- Less time spent in courtship leading to fewer offspring
The bacterium Helicobacter pylori lives in the human stomach and is usually passed from parents to their children. It evolved from a common ancestor in Africa. As humans migrated around the world, new strains of H. pylori evolved.
Figure 1 shows a phylogenetic diagram of the evolution of some of these strains.
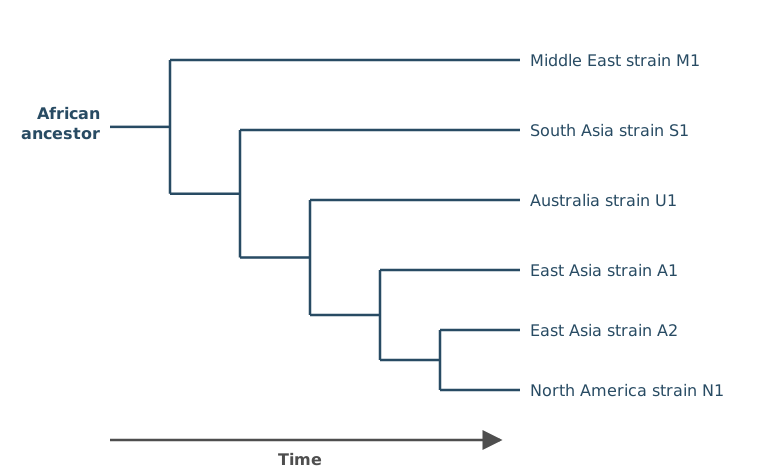
What does Figure 1 suggest is the order of human migration out of Africa?
Tick (✓) one box.
(1 mark) Revise this topic ↗Hint
Follow the time arrow from left to right. Which region’s strain branches off from the African ancestor first, and which next?
Mark Scheme
B: Middle East, South Asia, Australia, East Asia, North America (1 mark)
Tips
- Read the phylogenetic diagram from left to right: the earliest branch from the African ancestor is the Middle East (M1), then South Asia (S1), then Australia (U1), then East Asia (A1), then North America (N1)
Over the last 30 years, many bacteria have been moved into different genera and given new scientific names.
Suggest why.
(1 mark) Revise this topic ↗
Hint
What new evidence can scientists now use to compare bacteria that wasn’t available before?
Mark Scheme
DNA (or RNA) base sequencing, amino acid sequencing, or electron microscopes with greater resolution (1 mark)
Also accepted / rejected
Also accepted
- Genome sequencing
Not accepted
- “Sequencing” without saying base or amino acid sequencing
- “New technology” on its own
- The bacteria having evolved or mutated into new species
Tips
- Name the new evidence: DNA base sequencing, amino acid sequencing, or electron microscopes with greater resolution
- Include the word “base” in base sequencing
- “New technology” is too vague, and the bacteria haven’t changed; our knowledge of them has
In the ileum, bile salts emulsify lipids and are involved in forming micelles.
Explain how emulsification and the formation of micelles help the digestion and absorption of lipids.
(4 marks) Revise this topic ↗
Hint
There are two roles to explain. Think about what emulsification does to the size of lipid droplets and why that helps lipase, then how micelles get the products of digestion to the epithelial cells.
Mark Scheme
Emulsification
- Bile salts break the lipids into small droplets, which increase the surface area (1 mark)
- So there is faster hydrolysis by lipase (1 mark)
Micelles
- Micelles carry fatty acids and monoglycerides to the cell-surface membrane of the cells lining the ileum (1 mark)
- So the fatty acids and monoglycerides diffuse into the cells (1 mark)
Also accepted / rejected
Also accepted
- Point 3: micelles make fatty acids and monoglycerides more soluble, or keep their concentration high next to the membrane
- “Lining of the ileum” or “epithelium” instead of “cell”
Tips
- Don’t stop at “increases surface area”: add that this speeds up hydrolysis by lipase
- Emulsification doesn’t hydrolyse lipids itself; it breaks them into smaller droplets, giving a larger surface area so lipase hydrolyses them faster
- Keep the two roles separate: emulsification helps digestion, micelles help absorption
- Say micelles carry fatty acids and monoglycerides to the cells lining the ileum, not just into the lumen
- Name the molecules (fatty acids/monoglycerides) and say they diffuse into the cells; “fatty acids are absorbed” isn’t enough
Hint
Pre-mRNA contains both coding and non-coding sections. Which sections are removed?
Mark Scheme
- The introns are removed (and the exons are joined together) (1 mark)
Also accepted / rejected
Also accepted
- Describing the introns as the non-coding sections
Not accepted
- “The pre-mRNA is spliced” on its own, without saying what is removed
Tips
- Don’t just write “pre-mRNA is spliced”: say the introns are removed (and the exons joined)
Figure 1 shows the energy contained in molecules during an enzyme-controlled reaction.
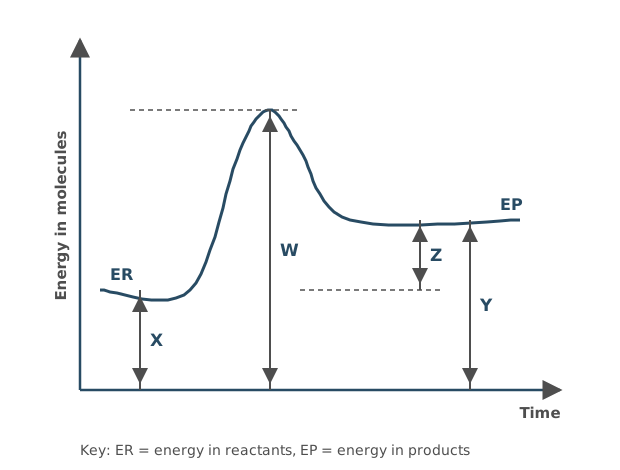
Which expression represents the activation energy (Ea) of this reaction?
Tick (✓) one box.
Hint
Activation energy is the energy needed to start the reaction. Find the difference between the energy of the reactants and the peak of the curve.
Mark Scheme
B) W − X (1 mark)
Activation energy is measured from the energy of the reactants (top of X) up to the peak of the curve (top of W).
Tips
- Measure activation energy from the energy of the reactants (ER) up to the peak of the curve: W − X. W − Y measures from the products instead
Complete Table 1 by adding a tick (✓) if the feature is present in the biological molecule.
Table 1
| Feature | Lactose | Starch | RNA |
|---|---|---|---|
| Contains glucose | |||
| Contains galactose | |||
| Contains fructose | |||
| Contains phosphate | |||
| Formed by condensation reaction(s) | |||
| Is a polymer |
(3 marks) Revise this topic ↗
Hint
For each molecule, think about which monomers it is made from and whether it is made of many repeating units.
Mark Scheme
1 mark for each correct column (3 marks)
| Feature | Lactose | Starch | RNA |
|---|---|---|---|
| Contains glucose | ✓ | ✓ | |
| Contains galactose | ✓ | ||
| Contains fructose | |||
| Contains phosphate | ✓ | ||
| Formed by condensation reaction(s) | ✓ | ✓ | ✓ |
| Is a polymer | ✓ | ✓ |
Maltase catalyses the hydrolysis of maltose into glucose.
A student investigated the effect of a drug called acarbose on maltase activity.
The student used the following method.
- Mix together (in tube X) solutions of maltose, acarbose and maltase in a 14 : 3 : 2 volume ratio so that the total volume is 80 cm³
- Leave the mixture at 37 °C for 10 minutes.
- Measure the glucose concentration in the mixture.
- Repeat steps 1 to 3 with two different mixtures.
Calculate the volume of acarbose solution used in tube X.
Volume of acarbose = ________ cm³
(1 mark) Revise this topic ↗
Hint
Add up all the parts of the ratio first, then work out what fraction of the total volume is acarbose.
Mark Scheme
12.6 cm³ (1 mark)
Working: 14 + 3 + 2 = 19 parts, so 80 ÷ 19 × 3 = 12.6
Also accepted / rejected
Also accepted
- 13, or any value that rounds to 12.6
Tips
- Add all the parts of the ratio: 14 + 3 + 2 = 19
- Don’t round partway through; work out 80 ÷ 19 × 3 in one go
Maltase catalyses the hydrolysis of maltose into glucose.
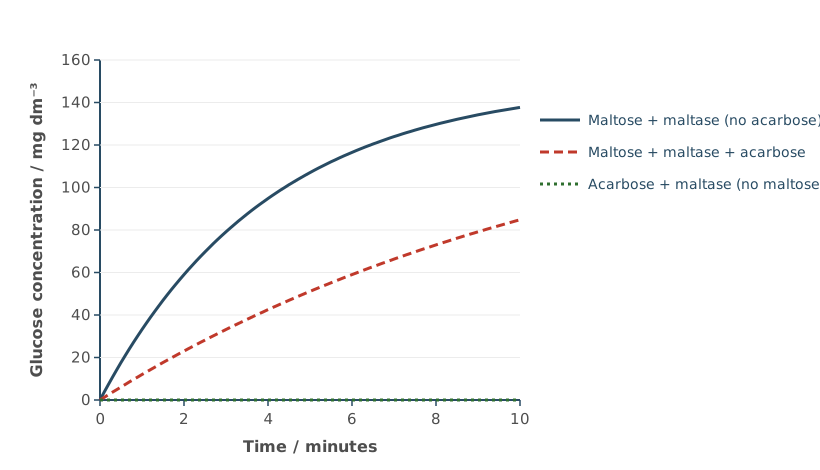
A student made three mixtures and measured the glucose concentration in each one over 10 minutes. Figure 1 shows the results.
Acarbose is a competitive inhibitor of maltase.
Use this information and your knowledge of enzymes to explain the results for each mixture.
(4 marks) Revise this topic ↗
Hint
Compare the three lines. What does a competitive inhibitor compete with, and where does it bind? Why is there no glucose at all in one mixture?
Mark Scheme
Maltose + maltase + acarbose
- Acarbose binds to the active site of maltase (1 mark)
- So it slows down the hydrolysis of maltose, and less glucose is made (1 mark)
Maltose + maltase (no acarbose)
- With no acarbose (no inhibitor), more maltose is hydrolysed, so more glucose is produced (1 mark)
Acarbose + maltase
- There is no maltose (no substrate), so no glucose is made; acarbose is not a substrate of maltase (1 mark)
Also accepted / rejected
Also accepted
- “Digested” or “broken down” instead of “hydrolysed”
Not accepted
- Saying acarbose stops the hydrolysis (glucose is still made when acarbose is there)
Tips
- With acarbose, say it binds to the active site; “a binding site” or “an allosteric site” doesn’t get the mark
- Say acarbose slows (reduces) the hydrolysis of maltose, not that it stops it: glucose is still made
- The question says the inhibitor is competitive, so don’t describe non-competitive inhibition. Acarbose binds to the active site of maltase, not to maltose
- For the mixture with no acarbose, link more maltose being hydrolysed to more glucose being produced
Maltase catalyses the hydrolysis of maltose into glucose. A student mixed maltose, maltase and a drug called acarbose, and measured how much glucose was produced in 10 minutes.
Give:
- one change the student could make to confirm that acarbose is a competitive inhibitor
- the result you would expect.
(2 marks) Revise this topic ↗
Hint
A competitive inhibitor competes with the substrate for the active site. What could you change so that the substrate wins more often, and what would you then see?
Mark Scheme
- Increase the concentration of maltose (the substrate) (1 mark)
- Expect more glucose to be produced, or a faster rate of reaction (1 mark)
Tips
- Increase the substrate (maltose) concentration and say you would expect more glucose to form: more maltose outcompetes acarbose for the active site. With a non-competitive inhibitor, adding more substrate would not reduce the inhibition
- Changing the acarbose concentration only changes how much inhibition there is, not which type it is
In a leaf, sucrose is moved into companion cells before it enters the phloem.
Figure 1 shows part of the cell-surface membrane of a companion cell in a leaf.
- Carrier protein X is linked to an ATP hydrolase enzyme.
- Carrier protein Y co-transports H⁺ ions and sucrose molecules in the same direction.
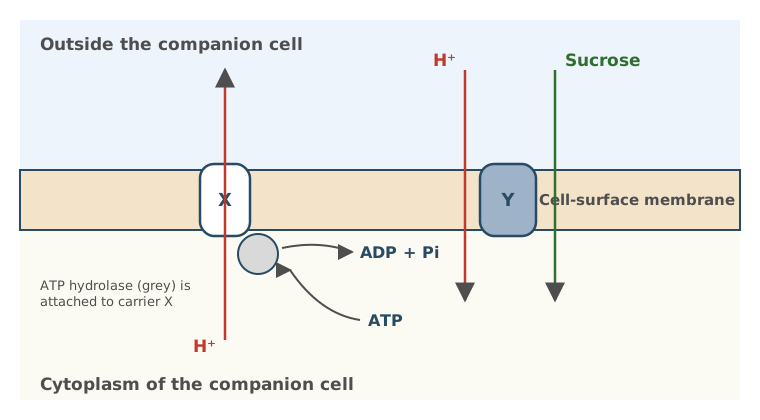
Use Figure 1 and the information above to explain how sucrose is moved into the companion cell, and why water then enters the cell.
Your answer should refer to the role of:
- ATP hydrolase
- carrier protein X and carrier protein Y.
(4 marks) Revise this topic ↗
Hint
Follow the H⁺ ions: how do they get out of the cell, and what happens as they move back in through Y? Then think about what the extra sucrose does to the water potential of the cell.
Mark Scheme
- ATP hydrolysis releases energy (1 mark)
- Which X uses for the active transport of H⁺ out of the companion cell (1 mark)
- H⁺ moves back in through Y, causing the co-transport of sucrose into the companion cell (1 mark)
- This lowers the water potential of the companion cell, so water moves in by osmosis (1 mark)
Also accepted / rejected
Also accepted
- “More negative water potential” (point 4)
Not accepted
- Saying energy is made, produced or created (point 1)
- “Hydrogen” instead of H⁺ or hydrogen ions
Tips
- Say ATP hydrolysis releases energy; never say energy is “produced”, “made” or “created”
- Write H⁺ (hydrogen ions), not “hydrogen”
- Give the direction of every movement: H⁺ is actively transported out of the cell by X
- Sucrose enters by co-transport through Y as H⁺ moves back in down its concentration gradient; don’t say sucrose is actively transported or enters by facilitated diffusion
- Explain the water movement using water potential: more sucrose lowers the water potential of the cell, so water enters by osmosis
Figure 1 shows part of the cell-surface membrane of a companion cell in a leaf.
- Carrier protein X is linked to an ATP hydrolase enzyme.
- Carrier protein Y co-transports H⁺ ions and sucrose molecules in the same direction.
A respiratory inhibitor caused a change in the pH of the solution outside the companion cell.
Use information in Figure 1 to explain how.
(3 marks) Revise this topic ↗
Hint
What does a respiratory inhibitor stop the cell producing? Follow what that means for ATP hydrolase and carrier protein X, then link the H⁺ concentration outside the cell to pH.
Mark Scheme
- Less ATP is produced (1 mark)
- So less ATP is hydrolysed and less energy is released for carrier protein X (1 mark)
- So fewer H⁺ are pumped out of the cell (while H⁺ still move in through Y), and the pH outside the cell increases (1 mark)
Also accepted / rejected
Also accepted
- “Less acidic”, or a sensible change in pH value, e.g. from pH 5 to pH 6 (point 3)
Not accepted
- “No energy is produced” (point 2)
Tips
- Start with the first link: the respiratory inhibitor means less ATP is produced
- Then say less ATP is hydrolysed, so less energy is released for carrier protein X. Say “less energy released”, not “no energy produced”
- Link H⁺ to pH: fewer H⁺ are pumped out of the cell (while H⁺ still move in through Y), so the pH outside increases
- Use Figure 1; you don’t need details of respiration such as chemiosmosis
In companion cells, carrier protein X actively transports H⁺ ions out of the cell. Carrier protein Y co-transports H⁺ ions and sucrose molecules into the cell.
Explain how a change in the expression of the genes coding for these carrier proteins could increase the rate at which sucrose is loaded into companion cells.
(2 marks) Revise this topic ↗
Hint
What does increased expression of a gene produce more of? How would more of carrier proteins X and Y affect the movement of H⁺ and sucrose?
Mark Scheme
- More expression of the genes produces more carrier proteins X and Y (1 mark)
- So there is faster active transport of H⁺ out of the cell and faster co-transport of sucrose into it (1 mark)
Also accepted / rejected
Not accepted
- Sucrose moving out of the companion cell
Tips
- Treat the change in gene expression as more of the genes being expressed, so more carrier proteins X and Y are made; it is not a mutation
- Don’t describe changes to the tertiary structure of the carrier proteins
- Link more carrier proteins to faster transport: more H⁺ actively transported out, or more sucrose co-transported in
Octopus blood contains the respiratory pigment haemocyanin.
Figure 1 shows the dissociation curve for oxyhaemocyanin in a species of octopus at two temperatures.
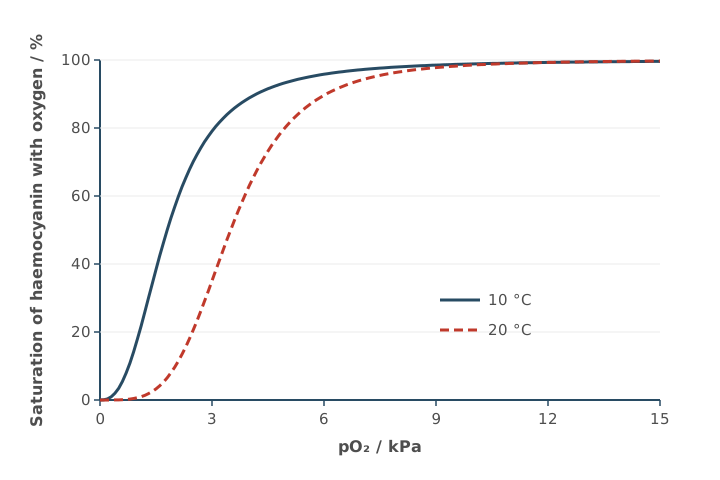
Octopuses use gills for gas exchange.
Using Figure 1, explain how a rise in temperature from 10 °C to 20 °C affects the loading and unloading of oxygen by haemocyanin.
In your answer, compare what happens at the gills, where the partial pressure of oxygen is high, with what happens in the tissues, where it is low.
(2 marks) Revise this topic ↗
Hint
Find the high pO₂ part of the graph (the gills) and the low pO₂ part (the tissues). Where do the two curves overlap, and where are they different?
Mark Scheme
- At low pO₂ (in the tissues), haemocyanin unloads more oxygen at 20 °C because its affinity is lower (1 mark)
- At high pO₂ (at the gills), temperature has no effect on loading (1 mark)
Also accepted / rejected
Also accepted
- Any pO₂ below about 9 kPa for “low”, and above 9 kPa for “high”
- The converse: at 10 °C haemocyanin unloads less readily in the tissues
Not accepted
- Haemocyanin loading oxygen in the tissues, or unloading it at the gills
Tips
- Link each part of the curve to a place: high pO₂ (above about 9 kPa) is the gills, low pO₂ is the tissues
- At high pO₂ the two curves overlap, so say temperature has no effect on loading at the gills
- At low pO₂ say haemocyanin unloads more oxygen at 20 °C (it has a lower affinity)
- Don’t say a lower affinity helps haemocyanin load oxygen at the gills: loading happens at high pO₂, where temperature makes no difference
Haemocyanin is colourless when it carries no oxygen, and turns a deeper blue as more oxygen binds to it.
A scientist wants to find the percentage oxygen saturation of haemocyanin in samples of octopus blood. She already has a set of octopus blood samples in which the percentage oxygen saturation is known.
Explain how she could use these known samples to make a calibration curve, and give one variable she should keep the same while collecting the data.
(3 marks) Revise this topic ↗
Hint
The colour of haemocyanin changes with oxygen saturation. Which piece of equipment measures colour, and what would you plot against what to make the curve?
Mark Scheme
- Measure each known sample with a colorimeter (1 mark)
- Plot absorbance (or transmission) on the y-axis against percentage oxygen saturation on the x-axis, and draw a line or curve of best fit (1 mark)
Variable kept the same
- The same volume of each sample, the same temperature, or the same filter (colour of light) (1 mark)
Also accepted / rejected
Not accepted
- “Calorimeter”
- Absorbance on the x-axis
- “Amount” instead of volume
Tips
- Use a colorimeter (not a calorimeter) to measure the colour of each sample
- Plot absorbance (or transmission) on the y-axis against percentage oxygen saturation on the x-axis
- You are given samples of known saturation, so you don’t need to make a dilution series
- Give a control variable that fits this procedure: the same volume of sample (not “amount”), temperature, or the same filter (wavelength of light). “The same colorimeter” doesn’t gain the mark
Scientists measured how long mice could run on a treadmill at different speeds before they got tired and stopped. How long a mouse can keep running depends on how quickly its heart and blood can deliver oxygen to its muscles.
Figure 1 shows the mean time the mice could run for at each speed.
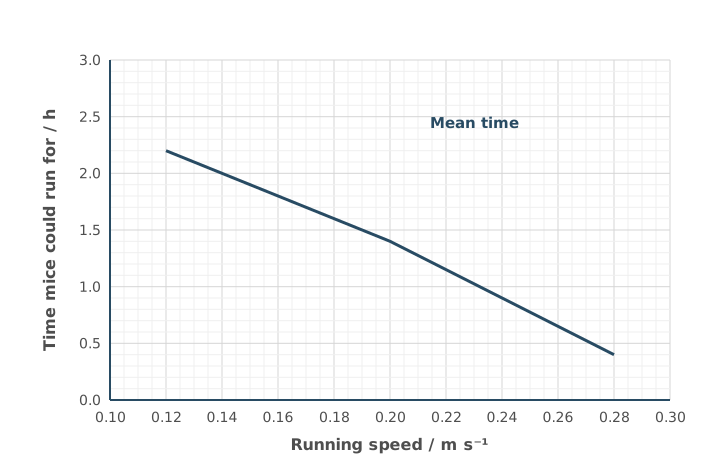
A mouse running at 0.20 m s⁻¹ covered a distance of 360 m in 30 minutes.
Use Figure 1 to calculate the extra distance this mouse could cover if it continued running at 0.20 m s⁻¹ before it stopped running.
Show your working.
Extra distance = ________ m
(2 marks) Revise this topic ↗
Hint
Read the mean running time at 0.20 m s⁻¹ from the graph. The mouse has already run for 30 minutes, so how much longer can it run? Convert that time into seconds before using the speed.
Mark Scheme
648 m (2 marks)
Working: at 0.20 m s⁻¹ the mice ran for 1.4 h. This mouse has 1.4 − 0.5 = 0.9 h left = 3240 s, and 3240 × 0.20 = 648 m.
If the answer is wrong, 1 mark for any of:
- reading 1.4 h (84 minutes) from the graph
- the time left: 0.9 h (54 minutes or 3240 s)
- the total distance: 1008 m
- a wrong graph reading used correctly (reading in s × 0.20 − 360)
Tips
- Read the graph carefully: at 0.20 m s⁻¹ the line is at 1.4 h
- Take off the 30 minutes already run (0.9 h left), and convert to seconds before multiplying by the speed
- Always show your working: a correct method with a misread value still earns 1 mark
Scientists measured how long mice could run on a treadmill at different speeds before they got tired and stopped. How long a mouse can keep running depends on how quickly its heart and blood can deliver oxygen to its muscles. The mice were selected at random from one breeding colony. Before the investigation, the mice were equally rested and fed identical diets.
Figure 1 shows the time each mouse ran for, and a line the scientists drew joining the mean time at each speed.
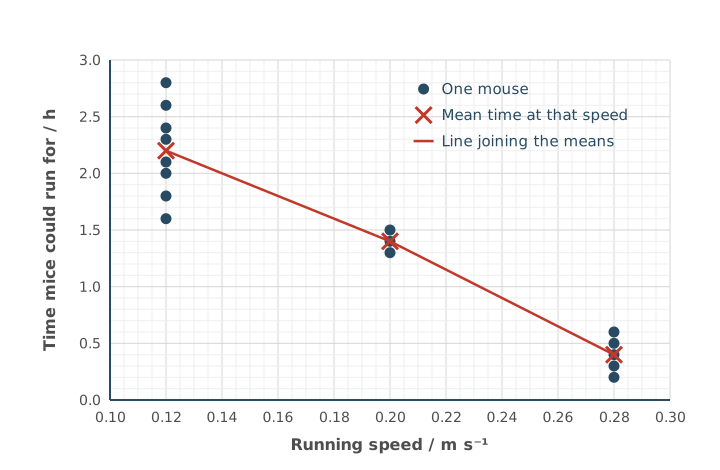
A student wants to use the line to predict how long a mouse could run at 0.16 m s⁻¹.
Use information in Figure 1 to explain why this prediction may not be reliable.
(3 marks) Revise this topic ↗
Hint
Is there any data at 0.16 m s⁻¹? How many speeds were tested? Compare the number of mice, and the spread of their times, at each speed.
Mark Scheme
Max 3 marks
- Only three speeds were tested, so there is no data near 0.16 m s⁻¹ (1 mark)
- The number of mice differs at each speed (1 mark)
- The spread (range) of times differs at each speed (1 mark)
- The sample is small (few mice) (1 mark)
Tips
- Point out that only three running speeds were investigated, so the line is guessed between them, and that the sample was small
- Look at how the data are spread: the number of mice differed at each speed, and each speed covered a different range of times
- The line already joins mean values, so don’t suggest using means, or medians instead
- Don’t suggest adding error bars or mention anomalies unless the data show them
Pollen grains are made inside the anthers of flowers:
- each diploid cell in an anther goes through four mitotic divisions
- each of the cells this produces then goes through one meiotic division to make pollen grains.
Calculate the minimum number of diploid cells needed to produce 3.6 × 10⁶ pollen grains.
Give your answer in standard form.
Show your working.
Answer = ________ diploid cells
(2 marks) Revise this topic ↗
Hint
Each mitotic division doubles the number of cells. How many cells does one diploid cell give after four divisions, and how many pollen grains does each of those make by meiosis?
Mark Scheme
5.625 × 10⁴ (2 marks)
Working: four mitotic divisions give 2⁴ = 16 cells; each makes 4 pollen grains, so 64 pollen grains per diploid cell; 3.6 × 10⁶ ÷ 64 = 5.625 × 10⁴
If the answer is wrong, 1 mark for any of:
- 16 (2⁴) cells after four mitotic divisions
- 2.25 × 10⁵ (3.6 × 10⁶ ÷ 16)
- 64 (2⁶) pollen grains from one diploid cell
- the right answer but not in standard form (56 250)
Also accepted / rejected
Also accepted
- Correct rounding, e.g. 5.6 × 10⁴ or 6 × 10⁴
Tips
- “One meiotic division” means one complete meiosis, so each cell produces 4 pollen grains, not 2. Using 2⁵ (32) instead of 2⁶ (64) is a common error
- Give your final answer in standard form, as the question asks
- Round correctly: 5.625 × 10⁴ rounds to 5.6 × 10⁴, not 5.7 × 10⁴
A diploid cell in an anther goes through interphase before a meiotic division that produces pollen grains.
A scientist determined that the mass of DNA in one of these cells at the start of interphase is 6 arbitrary units.
Draw a bar chart showing the mass of DNA in one cell in each of these phases:
- at the start of interphase
- at the end of interphase
- at the end of the first meiotic division
- at the end of the second meiotic division.
(3 marks) Revise this topic ↗
Hint
DNA replicates during interphase. What happens to the mass of DNA in one cell after each of the two meiotic divisions?
Mark Scheme
- Bars labelled with the four phases, y-axis labelled DNA mass per cell / arbitrary units, a linear scale and bars not touching (1 mark)
- 6 at the start of interphase and 12 at the end (1 mark)
- 6 after the first meiotic division and 3 after the second (1 mark)
For example,
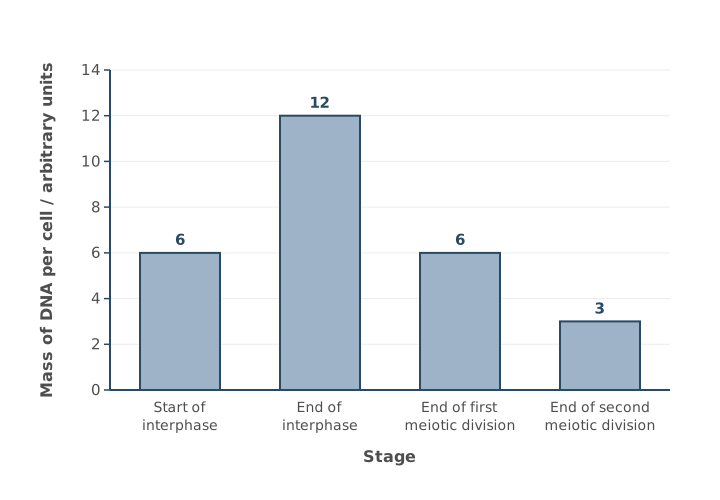
Also accepted / rejected
Also accepted
- If points 2 and 3 are wrong: bars that show the DNA mass halving in each meiotic division, for 1 mark
Not accepted
- A y-axis scale that is too small to read the values
Tips
- Label the y-axis fully: DNA mass per cell (arbitrary units)
- Leave gaps between the bars: this is a bar chart, not a histogram
- Use a linear scale on the y-axis that is large enough to read the values
- Plot the right values: 6 at the start of interphase, 12 at the end (the DNA has replicated), 6 after the first meiotic division and 3 after the second
Some gametes have one fewer chromosome than normal, because of a mutation during meiosis.
Name this type of mutation and explain how it happens.
(3 marks) Revise this topic ↗
Hint
Name the mutation where chromosomes fail to separate. Then think about where both chromosomes (or both chromatids) of a pair end up during the division, and what that leaves for the other cell.
Mark Scheme
Max 3 marks
- Non-disjunction (1 mark)
- Homologous chromosomes (or sister chromatids) fail to separate (1 mark)
- Both chromosomes (or chromatids) of the pair move to the same pole, e.g. because they are not attached to the spindle fibres (1 mark)
Also accepted / rejected
Also accepted
- “Monosomy” or “aneuploidy” (point 1)
- A labelled diagram showing both chromosomes moving to one pole (point 3)
Not accepted
- Polyploidy, or changes in whole sets of chromosomes
Tips
- Name the mutation as non-disjunction, and spell it carefully (not “non-disfunction”). Polyploidy (changes in whole sets) is not accepted
- Say that homologous chromosomes (or chromatids) fail to separate
- Explain what happens: both chromosomes (or chromatids) of the pair move to the same pole, e.g. because they are not attached to the spindle fibres, so the other gamete gets neither
- Don’t just restate that the gamete is missing a chromosome; the question already tells you that
Antibiotic resistance alleles are often located in plasmids.
There are 9 different types of plasmid inside cells of a species of soil bacterium.
A scientist determined the:
- length of each type of plasmid in kilobase pairs (kbp)
- mean plasmid copy number (mean number of each type of plasmid per cell).
Table 1 shows the scientist’s results for 5 of these plasmids.
Table 1
| Plasmid | Plasmid length / kbp | Mean plasmid copy number | Rank of plasmid length | Rank of mean plasmid copy number | Squared difference between ranks (d²) |
|---|---|---|---|---|---|
| R | 40 | 22 | 3 | 3 | 0 |
| P | 3 | 85 | 1 | 4 | 9 |
| T | 260 | 5 | 5 | 2 | 9 |
| Q | 9 | 120 | 2 | 5 | 9 |
| S | 110 | 2 | 4 | 1 | 9 |
The Spearman rank correlation coefficient (rs) between plasmid length and mean plasmid copy number is determined using this equation.
rs = 1 − 6Σd²n(n² − 1)
where
- Σd² = the sum of all d² figures
- n = 5 (the highest rank number)
Use information in Table 1 and the formula to calculate the rs value for this set of data.
Show your working.
rs = ________
(2 marks) Revise this topic ↗
Hint
The d² values are already in the table, so just add them up. Work out the top and bottom of the fraction separately, divide, then subtract the result from 1.
Mark Scheme
−0.8 (2 marks)
Working: Σd² = 36; 6 × 36 = 216; 5 × (25 − 1) = 120; 216 ÷ 120 = 1.8; 1 − 1.8 = −0.8
If the answer is wrong, 1 mark for any of:
- 216 (top of the fraction)
- 120 (bottom of the fraction)
- 1.8 (the fraction worked out)
- 0.8 (the right number but positive)
Tips
- The last column is already d², so add those numbers (Σd² = 36); don’t square them again
- Keep the “1 −” outside the fraction: work out 6Σd² ÷ n(n² − 1) first, then subtract it from 1
- Use n = 5 (the number of plasmids), not a value from the table
- Show your working: a correct numerator (216) or denominator (120) still earns a mark if your final answer is wrong
Scientists investigated the 9 different types of plasmid inside cells of a species of soil bacterium.
They determined that the Spearman rank correlation coefficient (rs) between plasmid length and mean plasmid copy number for all 9 types of plasmid is −0.91
What can you conclude from this rs value?
(1 mark) Revise this topic ↗
Hint
Look at the sign and the size of the value. What do they tell you about the direction and strength of the relationship?
Mark Scheme
- A strong negative correlation (1 mark)
Also accepted / rejected
Also accepted
- “Significant” instead of “strong”
Tips
- State what the value shows: −0.91 is close to −1, so there is a strong negative correlation between plasmid length and mean plasmid copy number
The length of the single circular (non-plasmid) DNA molecule in a cell of a species of soil bacterium is 4200 kbp
The total length of all plasmid DNA molecules in a cell is 35% greater than the length of the single circular DNA molecule.
Calculate the total number of kbp in all the plasmid molecules in a cell.
Show your working.
Answer = ________ kbp
(2 marks) Revise this topic ↗
Hint
35% greater means the original length plus another 35% of it. What do you multiply 4200 by?
Mark Scheme
5670 kbp (2 marks)
Working: 4200 × 1.35 = 5670
If the answer is wrong, 1 mark for:
- 1470 (the extra 35%), or using × 1.35
Tips
- 4200 × 1.35 = 5670 kbp
- Stop at 5670 kbp: this is already the total for all the plasmids, so don’t multiply by the number of plasmid types
A scientist grew a culture of a spore-forming bacterium at 25 °C for 18 hours. The population went through three phases: germination, growth and dormancy.
Every hour, the scientist measured:
- the cloudiness of the culture, which increases as the number of cells increases
- the mean number of copies of plasmid P in each cell.
Figure 1 shows the results.
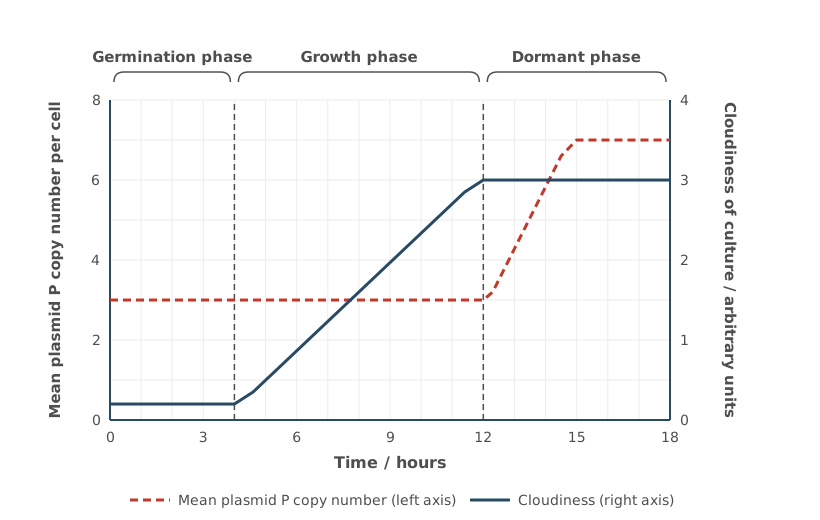
For each phase, use Figure 1 to conclude whether binary fission and the replication of plasmid P are taking place.
(3 marks) Revise this topic ↗
Hint
Cloudiness shows the number of cells, so a rise means binary fission is happening. A rise in copy number per cell means plasmids are replicating faster than the cells divide. If the number of cells rises but the copy number per cell stays the same, what must the plasmids be doing?
Mark Scheme
Max 3 marks
Germination phase
- No binary fission and no plasmid replication (1 mark)
Growth phase
- Binary fission happens and the plasmids replicate (keeping pace with the cells) (1 mark)
Dormant phase
- The plasmids replicate but there is no binary fission (1 mark)
Also accepted / rejected
Also accepted
- Times (e.g. 0 to 4 hours) or “first phase” instead of the phase names
- “Cell division” instead of “binary fission”
Not accepted
- A conclusion that isn’t clearly linked to a phase
Tips
- Don’t just describe the graph (“copy number stayed the same”, “cloudiness plateaued”); conclude what it means: whether binary fission and plasmid replication are happening
- Link each conclusion clearly to a named phase (or its time period)
- Use cloudiness to decide about binary fission, and plasmid copy number to decide about plasmid replication
Figure 1 is an electron micrograph of part of a chloroplast in a leaf cell.
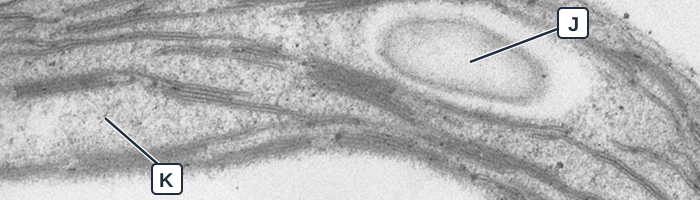
Micrograph: B. Zechmann (2019), PLOS ONE 14(4): e0214811, Fig. 1A, CC BY 4.0. Cropped and labelled.
Identify the parts labelled J and K.
(1 mark) Revise this topic ↗
Hint
J is a pale oval structure, separate from the stacked membranes; think about what a chloroplast stores. K is the granular fluid around the membranes.
Mark Scheme
J is a starch grain (or a lipid droplet) and K is the stroma (1 mark, both needed)
Also accepted / rejected
Not accepted
- “Stoma” for stroma
Tips
- J is a round structure separate from the grana: a starch grain (or lipid droplet), not a thylakoid or granum
- A chloroplast is an organelle, so it doesn’t contain a vacuole or nucleus
- K is the stroma; spell it carefully, because a stoma is a pore in a leaf
Some plants grow on the floor of dense forests, where very little light reaches them.
Scientists compared chloroplasts from a forest-floor plant with chloroplasts from a plant of the same species growing in full sunlight. They counted structures in electron micrographs.
Table 1
| Plant in full sunlight | Forest-floor plant | |
|---|---|---|
| Mean number of grana per chloroplast | 30 | 45 |
| Mean number of thylakoids per granum | 6 | 18 |
Use Table 1 to suggest how the chloroplasts of the forest-floor plant help it to photosynthesise in low light.
Justify your answer.
(2 marks) Revise this topic ↗
Hint
What is different about the thylakoids in the forest-floor plant? What pigment do thylakoid membranes contain, and what does it do?
Mark Scheme
- The forest-floor plant has more grana and more thylakoids (1 mark)
- So it has more chlorophyll, absorbs more light and can photosynthesise more in low light (1 mark)
Also accepted / rejected
Also accepted
- “Larger” or “bigger” grana (point 1)
- “More light-dependent reaction” instead of “more photosynthesis” (point 2)
Tips
- Give the full chain for the second mark: more grana (thylakoids), so more chlorophyll, so more light absorbed, so more photosynthesis
- Write “light-dependent reaction” in full, not “LDR”
Scientists studied a pale-green mutant of rice. The mutant has a gene mutation that reduces the activity of an enzyme used to make chlorophyll b. From electron micrographs, they predicted that the mutant would photosynthesise less than normal rice, because its chloroplasts had fewer thylakoids.
Chlorophyll a and chlorophyll b are two types of chlorophyll used in photosynthesis. Table 1 shows the scientists’ results.
Table 1
| Chlorophyll a / µg cm⁻² | Chlorophyll b / µg cm⁻² | Rate of oxygen production in bright light / arbitrary units | |
|---|---|---|---|
| Normal rice | 30 | 10 | 12 |
| Mutant rice | 9 | 1 | 18 |
The results did not support the prediction.
Use Table 1 to describe and explain the effect of the mutation.
(3 marks) Revise this topic ↗
Hint
Work out the total chlorophyll and the ratio of chlorophyll a to chlorophyll b for each plant. Does the mutant have more chlorophyll a overall, or just a larger proportion of chlorophyll a compared with b?
Mark Scheme
- The mutant has less chlorophyll (10 v 40 µg cm⁻²) but a higher rate of photosynthesis (1 mark)
- The mutation increased the ratio of chlorophyll a to chlorophyll b (9 : 1 v 3 : 1) (1 mark)
- So the mutant absorbs more light (1 mark)
Also accepted / rejected
Also accepted
- “Relatively more chlorophyll a than b” (point 2)
- “Absorbs a greater range of wavelengths” (point 3)
Not accepted
- Saying the mutant has more chlorophyll a (it has less: 9 v 30)
Tips
- Describe the key contrast: the mutant has less chlorophyll overall but a higher rate of photosynthesis
- Work out the ratio: 30 : 10 is 3 : 1, and 9 : 1 is higher. The mutant has relatively more chlorophyll a, not more chlorophyll a overall
- Say the mutant absorbs more light (or a greater range of wavelengths), but don’t say this is because it has “more” chlorophyll a
Table 1 shows the formulas of three fatty acids.
Table 1
| Fatty acid | Formula |
|---|---|
| Myristic acid | CH₃(CH₂)₁₂COOH |
| Palmitoleic acid | CH₃(CH₂)₅CH=CH(CH₂)₇COOH |
| Linoleic acid | CH₃(CH₂)₄CH=CHCH₂CH=CH(CH₂)₇COOH |
Which fatty acid in Table 1 is a saturated fatty acid?
(1 mark) Revise this topic ↗
Hint
What feature in a formula tells you a fatty acid is unsaturated? Which formula doesn’t have it?
Mark Scheme
Myristic acid (1 mark)
It has no C=C double bonds in its hydrocarbon chain.
Tips
- A saturated fatty acid has no C=C double bonds; look for “=” in the formulas
The more unsaturated fatty acids there are in the phospholipids of a cell-surface membrane, the more fluid the membrane is.
Amoeba is a single-celled organism that feeds by engulfing bacteria. Scientists grew Amoeba in a liquid rich in unsaturated fatty acids. They found:
- a higher proportion of unsaturated fatty acids in the phospholipids of its cell-surface membrane
- that each Amoeba engulfed more bacteria.
Suggest and explain why each Amoeba engulfed more bacteria.
(3 marks) Revise this topic ↗
Hint
What do more unsaturated fatty acids do to the membrane? Why would that make it easier for the cell to surround and take in a bacterium?
Mark Scheme
- More unsaturated fatty acids in the phospholipids increase the fluidity of the cell-surface membrane (1 mark)
- So the membrane is more flexible (1 mark)
- So it is easier to engulf bacteria (1 mark)
Also accepted / rejected
Also accepted
- Points 1 and 2 together: “more unsaturated fatty acids make the membrane more fluid” earns both
- “Endocytosis” or “phagocytosis” instead of “engulf” (point 3)
Tips
- Link the unsaturated fatty acids to the membrane: they make the cell-surface membrane more fluid; don’t just repeat the question
- Explain how a more fluid membrane makes engulfing easier
- The fatty acids are food, not antigens, so don’t describe an immune response
The epithelial cells lining the ileum have microvilli on their surface.
Describe what microvilli are.
(1 mark) Revise this topic ↗
Hint
Microvilli belong to a single cell. Which part of the cell are they made from?
Mark Scheme
Folds of the cell-surface membrane of a single epithelial cell (1 mark)
Also accepted / rejected
Also accepted
- “Projections” or “extensions” of the cell-surface membrane
Not accepted
- “Hairs”
Tips
- Microvilli are folds of the cell-surface membrane of one cell; villi are made of many cells, and cilia are something else
- “They increase the surface area” is what they do, not what they are
Vitamin D is a fat-soluble substance. Micelles are involved in its absorption.
Describe how vitamin D is absorbed into the cells lining the ileum.
(3 marks) Revise this topic ↗
Hint
The vitamin is absorbed whole; it isn’t digested. How do micelles help it reach the cells, and how does it get in?
Mark Scheme
Max 3 marks
- Vitamin D combines with bile salts (forming micelles) (1 mark)
- This makes it more soluble in water (1 mark)
- Micelles carry vitamin D to the cells lining the ileum, keeping its concentration high next to the membrane (1 mark)
- Vitamin D diffuses into the cells (1 mark)
Also accepted / rejected
Not accepted
- Describing vitamin D being digested into fatty acids or monoglycerides (max 2 marks)
- Saying the micelles themselves are absorbed
Tips
- Describe how the whole vitamin is absorbed; describing lipid digestion limits you to 2 marks
- Micelles form when vitamin D combines with bile salts; this is not emulsification
- The micelle carries vitamin D to the cells; the vitamin D, not the micelle, diffuses across the membrane
- Vitamin D enters by simple diffusion, not by co-transport
A student cut very thin sections of a plant stem to look at the xylem with an optical microscope.
Explain why the sections needed to be very thin.
(2 marks) Revise this topic ↗
Hint
What does an optical microscope need to pass through the specimen to form an image? What happens with a thick section?
Mark Scheme
- So there is only a single layer (or a few layers) of cells (1 mark)
- So light can pass through (1 mark)
Also accepted / rejected
Also accepted
- “So cells don’t overlap” (point 1)
Tips
- Explain why thin matters: one layer of cells, so light can pass through
- Thin sections don’t improve resolution or magnification
A scientist measured the diameter of five red blood cells on a photomicrograph, using a ruler.
Table 1
| Red blood cell | 1 | 2 | 3 | 4 | 5 |
|---|---|---|---|---|---|
| Diameter on the photomicrograph / mm | 15 | 16 | 14 | 15 | 15 |
The magnification of the photomicrograph is × 2000
Calculate the mean actual diameter of the red blood cells, in µm.
Show your working.
Answer = ________ µm
(2 marks) Revise this topic ↗
Hint
Find the mean diameter on the photomicrograph first. Rearrange magnification = image size ÷ actual size, and check your units.
Mark Scheme
7.5 µm (2 marks)
Working: mean = 75 ÷ 5 = 15 mm = 15 000 µm; actual size = image size ÷ magnification = 15 000 ÷ 2000 = 7.5 µm
If the answer is wrong, 1 mark for any of:
- actual size = image size ÷ magnification (the equation rearranged)
- ÷ 2000
- 15 000 µm (the mean diameter in µm)
- × 1000 (converting mm to µm)
- 0.0075 (right number but in mm)
- the right digits with the decimal point wrong, e.g. 0.75 or 75
Tips
- Rearrange the equation: actual size = image size ÷ magnification
- Find the mean first (15 mm), convert to µm (× 1000), then divide by 2000
- Check your decimal point: 7.5 µm is about the size of a real red blood cell
A student used a ruler with 1 mm divisions to measure the image of a cell. The measurement was 15 mm.
Give the uncertainty of a measurement made with this ruler, and calculate the percentage error of the 15 mm measurement.
Uncertainty = ± ________ mm
Percentage error = ________ %
(2 marks) Revise this topic ↗
Hint
A length measured with a ruler involves two readings, one at each end. What is the uncertainty of each reading?
Mark Scheme
- Uncertainty = ± 1 mm (1 mark)
- Percentage error = 1 ÷ 15 × 100 = 6.7% (1 mark)
Also accepted / rejected
Also accepted
- Point 2 worked out correctly from a wrong uncertainty, e.g. 13% (from 2 mm), 3.3% (from 0.5 mm) or 0.67% (from 0.1 mm)
Tips
- A ruler length needs two readings (start and end), each ± 0.5 mm, so the uncertainty is ± 1 mm
- Percentage error = uncertainty ÷ measurement × 100
A sports drink contains these sugars: glucose, fructose, galactose and maltose.
How many different monosaccharides does the sports drink contain?
(1 mark) Revise this topic ↗
Hint
Which of these sugars are single sugar units, and which is made of two joined together?
Mark Scheme
3 (glucose, fructose and galactose) (1 mark)
Also accepted / rejected
Also accepted
- Naming glucose, fructose and galactose
Tips
- Maltose is a disaccharide (two glucose units), so don’t count it
“Free sugar” is sugar added to food or drinks, and sugar in honey, syrups and fruit juice.
Health scientists recommend that no more than 5% of the energy we take in each day comes from free sugar.
A 7-year-old child needs 7600 kJ of energy a day. One teaspoon of honey contains 90 kJ of energy from free sugar.
Calculate how many teaspoons of honey would give this child the recommended maximum energy from free sugar in a day.
Number of teaspoons = ________ per day
(1 mark) Revise this topic ↗
Hint
Work out 5% of 7600 kJ first. How many teaspoons of honey give that much energy?
Mark Scheme
4.2 teaspoons (1 mark)
Working: 5% of 7600 = 380 kJ; 380 ÷ 90 = 4.2
Also accepted / rejected
Also accepted
- 4.22, or 5 (rounded up to reach the recommendation)
Not accepted
- 4 (rounding down gives less than the recommended maximum)
Tips
- Use only the free-sugar energy (5% of 7600 kJ = 380 kJ), not the whole daily requirement
- Don’t round 4.22 down to 4
A scientist put a Visking tubing bag of sucrose solution into a beaker of water (Figure 1). Water entered the bag by osmosis. This pushed the solution up the tube and increased the air pressure at the top by 600 kPa.
She then did the experiment again with the same volume of a different sucrose solution. This time the air pressure increased by only 150 kPa.
How did the concentration of the second solution compare with the first? Use the pressure figures to support your answer.
(2 marks) Revise this topic ↗
Hint
Would a weaker or a stronger sucrose solution draw less water into the bag? 150 kPa is what fraction of 600 kPa?
Mark Scheme
- The second solution was more dilute (lower concentration), so there was a smaller water potential gradient and less water moved in (1 mark)
- 150 ÷ 600 = 0.25, so it was diluted 4 times (25% of the original concentration) (1 mark)
Also accepted / rejected
Also accepted
- “Higher (less negative) water potential” (point 1)
- 1 part sucrose solution to 3 parts water, e.g. 25 cm³ solution and 75 cm³ water (point 2)
Tips
- A more dilute solution has a higher water potential, so the gradient is smaller and less water enters the bag
- Use the figures: 150 kPa is a quarter of 600 kPa, so the solution was diluted 4 times
A scientist used an optical microscope to find the mitotic index of cells at different distances from the tip of a garlic root.
Give the word equation used to calculate a mitotic index.
Mitotic index = ________
(1 mark) Revise this topic ↗
Hint
A mitotic index is a proportion. What do you count on top, and what goes underneath?
Mark Scheme
Mitotic index = number of cells in mitosis ÷ total number of cells (in the field of view) (1 mark)
Also accepted / rejected
Also accepted
- “Cells with visible chromosomes” instead of “cells in mitosis”
Not accepted
- Multiplying by 100 (the mitotic index is a proportion, not a percentage)
Tips
- Count the number of cells with visible chromosomes, not the number of chromosomes
- Divide by the total number of cells, not by anything else
A scientist used an optical microscope to find the mitotic index of cells at different distances from the tip of a garlic root.
Figure 1 shows the results.
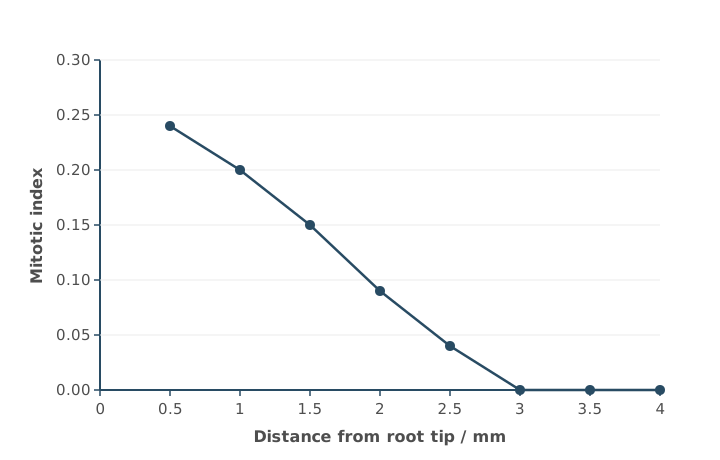
The scientist calculated a correlation coefficient (r) for these data and used a statistical test to find the probability (P) of getting this value of r by chance.
r = − 0.96 (P < 0.01)
What can you conclude from this result?
(2 marks) Revise this topic ↗
Hint
What do the sign and size of r tell you? What does P < 0.01 tell you about the role of chance?
Mark Scheme
Max 2 marks
- A strong (or significant) negative correlation (1 mark)
- There is less than a 1% probability that this correlation is due to chance (1 mark)
- So the null hypothesis is rejected (1 mark)
Also accepted / rejected
Also accepted
- “More than 99% probability that the correlation is not due to chance” (point 2)
- “Relationship” instead of “correlation”
Not accepted
- Saying the “results” or “differences” are significant or not due to chance (point 2)
Tips
- Say the correlation is strong (or significant) and negative; “a negative correlation” alone isn’t enough
- Link P to the correlation and chance: less than a 1% probability that the correlation is due to chance
- Don’t compare the value of r with the value of P
A scientist used an optical microscope to find the mitotic index of cells at different distances from the tip of a garlic root.
Figure 1 shows the results.
What can you conclude about the effect of distance from the root tip on the proportion of cells in different stages of the cell cycle?
Use information from Figure 1.
(3 marks) Revise this topic ↗
Hint
The cell cycle has two main stages: mitosis and interphase. What happens to the proportion of cells in each as you move away from the tip?
Mark Scheme
- A greater proportion of cells are in mitosis closer to the tip (1 mark)
- A greater proportion of cells are in interphase further from the tip (1 mark)
- No cells are in mitosis at 3 mm or more from the tip (all are in interphase) (1 mark)
Also accepted / rejected
Also accepted
- A named stage of mitosis (points 1 and 3)
- G1, S or G2 instead of interphase (points 2 and 3)
Tips
- The cell cycle has two stages, mitosis and interphase: describe the proportion of cells in each
- Link the mitotic index to cells: say more cells are in mitosis near the tip, not just “the mitotic index decreases”
- Interphase counts too: more cells are in interphase further from the tip
- Use the data precisely, e.g. no cells are in mitosis at 3 mm or more
Table 1 shows some mRNA codons and the amino acid each codes for.
Table 1
| mRNA codon | Amino acid |
|---|---|
| CAU | His |
| GGA | Gly |
| GGU | Gly |
| GUA | Val |
| UGG | Trp |
Part of a gene codes for amino acids in the active site of an enzyme. When this part is transcribed, it gives the mRNA sequence CAU GGA UGG.
A mutation in this part of the gene changes the mRNA sequence to CAU GGU UGG.
Use all of this information to:
- name the type of mutation
- give the change in the template strand of the DNA
- explain the effect of the mutation on the function of the enzyme.
(4 marks) Revise this topic ↗
Hint
Which base in the mRNA changed? Work out the matching change in the template DNA. Then use Table 1: does the amino acid change?
Mark Scheme
Type of mutation
- Substitution (of one base) (1 mark)
Change in DNA
- Thymine replaced by adenine in the template strand (CCT becomes CCA) (1 mark)
Effect on the enzyme
- The new codon GGU still codes for Gly, so the amino acid doesn’t change (1 mark)
- So there is no change to the primary structure, the tertiary structure or the active site, and the enzyme works as normal (1 mark)
Also accepted / rejected
Also accepted
- “T to A” for point 2
- Marks can come from any part of the answer
Not accepted
- “Thiamine” for thymine
- Giving the change in the mRNA (A to U) as the change in DNA
Tips
- Use all the information: GGU still codes for Gly, so the amino acid doesn’t change. Not every mutation changes the protein
- Give the change in the DNA, not the mRNA: in the template strand, T is replaced by A
- This works because the genetic code is degenerate: more than one codon codes for Gly
When cut potato is left in air, an enzyme called catechol oxidase catalyses a reaction between colourless compounds in the potato and oxygen. This forms a brown pigment.
A student measured the time taken for the brown pigment to appear on 1 cm cubes of two potato varieties, P and Q, kept at 25 °C. She tested three cubes of each variety.
Her results were:
- variety P: 12 min 18 s, 10 min 48 s, 11 min 30 s
- variety Q: 4 min 42 s, 5 min 12 s, 5 min 30 s
Draw a results table for these data. Include the student’s results and the mean for each variety, with each mean given to 1 decimal place.
(3 marks) Revise this topic ↗
Hint
What goes in the left-hand column? Put each unit in a column heading, and use the same unit for every time.
Mark Scheme
- Variety (P and Q) in the left-hand column (1 mark)
- Column headings include time / min and mean time / min, with units only in the headings (1 mark)
- All times converted correctly and means correct to 1 decimal place (1 mark)
For example,
| Variety | Time 1 / min | Time 2 / min | Time 3 / min | Mean time / min |
|---|---|---|---|---|
| P | 12.3 | 10.8 | 11.5 | 11.5 |
| Q | 4.7 | 5.2 | 5.5 | 5.1 |
Also accepted / rejected
Also accepted
- All times in seconds, e.g. 738, 648, 690 and a mean of 692.0 s
- Means shown in a row instead of a column
Not accepted
- Mixed units, e.g. “minutes and seconds”
Tips
- Convert all the times into one unit before putting them in the table
- Put the unit in the column heading (e.g. Time / min), not next to each number
- Calculate the means correctly and give them to 1 decimal place
- Draw a table, not a bar chart
When cut potato is left in air, an enzyme called catechol oxidase catalyses a reaction between colourless compounds in the potato and oxygen. This forms a brown pigment.
The brown pigment appeared after a mean of 11.5 minutes on variety P, and after 5.1 minutes on variety Q.
Suggest and explain why the results for the two varieties are different.
(2 marks) Revise this topic ↗
Hint
Which variety reacted faster? What could there be more of in that variety?
Mark Scheme
- Variety Q has more substrate, more enzyme or more active enzyme (1 mark)
- So more enzyme-substrate complexes form (1 mark)
Also accepted / rejected
Also accepted
- The opposite for variety P (less substrate or enzyme)
Tips
- A shorter time means a faster reaction, so Q has more substrate or enzyme (or more active enzyme)
- Go on to say more enzyme-substrate complexes form
- Stick to substrate and enzyme; don’t bring in temperature
When cut potato is left in air, an enzyme called catechol oxidase catalyses a reaction between colourless compounds in the potato and oxygen. This forms a brown pigment.
A student timed how long the brown pigment took to appear on cubes of potato. She then repeated the investigation with one change to her method, and the brown pigment appeared sooner.
Suggest what the change could have been, and explain why the pigment appeared sooner. Do not suggest using a different mass or volume of potato.
(3 marks) Revise this topic ↗
Hint
Which factors affect the rate of an enzyme-controlled reaction? Choose one the student could change, then follow the chain to a faster reaction.
Mark Scheme
Max 3 marks, from one of these routes:
Raise the temperature
- Keep the potato at a higher temperature (closer to the optimum) (1 mark)
- So the molecules have more kinetic energy (1 mark)
- So more enzyme-substrate complexes form and the reaction is faster (1 mark)
Use the optimum conditions
- Use the enzyme’s optimum temperature or optimum pH (1 mark)
- So less of the enzyme is denatured (1 mark)
- So more enzyme-substrate complexes form and the reaction is faster (1 mark)
Cut it up
- Crush, grind or chop the potato (1 mark)
- So more enzyme and substrate come into contact with oxygen (1 mark)
- So more enzyme-substrate complexes form and the reaction is faster (1 mark)
Also accepted / rejected
Also accepted
- “Change the temperature”, as long as the explanation is right (points 1 and 4)
- Dicing, slicing or homogenising (point 7)
Tips
- A shorter time means a faster reaction
- Give the direction of any temperature change, e.g. increase it towards the optimum
- A higher temperature gives more kinetic energy and more enzyme-substrate complexes; it doesn’t lower the activation energy
- If you cut the potato, say more enzyme and substrate come into contact with oxygen, not just “a larger surface area”
When cut potato is left in air, an enzyme called catechol oxidase catalyses a reaction between colourless compounds in the potato and oxygen. This forms a brown pigment.
A student wants to measure the activity of catechol oxidase as the amount of product made.
Which method would work?
Tick (✓) one box.
Hint
Think about what each method actually measures, and whether it could work with a solid cube of potato.
Mark Scheme
D) Compare the brown colour of the potato with a colour chart (1 mark)
Tips
- Answer D: comparing the brown colour with a colour chart of known pigment concentrations measures how much product has formed
- The colorimeter (A) is the most common wrong answer. A colorimeter shines light through a liquid sample in a cuvette, so it can’t be used on a solid cube of potato: light can’t pass through it
- Check how a method would actually work, not just whether it involves colour
Plaques can build up in the walls of the carotid arteries, which carry blood to the brain. A plaque can break open and cause a blood clot, which can lead to a stroke. As a plaque builds up, it also makes the artery wall thicker.
Scientists measured the thickness of the carotid artery wall (t) in a large population of people over 60 years old. They worked out each person’s risk of a plaque forming.
Table 1
| Wall thickness, t / mm | Number of people | Risk of a plaque forming / % |
|---|---|---|
| t ≤ 0.8 | 1850 | 2 |
| 0.8 < t ≤ 1.0 | 1020 | 5 |
| 1.0 < t ≤ 1.2 | 260 | 14 |
| t > 1.2 | 12 | 61 |
Using all the information, what can you conclude about carotid artery wall thickness and the risk of a stroke?
(3 marks) Revise this topic ↗
Hint
Link the risk of a plaque to the risk of a stroke. Look at how the risk changes, how many people are in each group, and what a thick wall could already mean.
Mark Scheme
Max 3 marks
- As wall thickness increases, the risk of a plaque, and so of a stroke, increases (1 mark)
- Few people (12) are in the highest-risk group (1 mark)
- People with walls thicker than 1.2 mm have a much higher risk (61%), so may have a stroke (1 mark)
- A high risk doesn’t mean a plaque has formed or that a stroke will happen (1 mark)
Also accepted / rejected
Also accepted
- The opposite, e.g. thin walls (1.0 mm or less) mean a low risk (point 1)
- “Most people are at low risk” (point 2)
- “The risk rises steeply above 1.2 mm” (point 3)
Tips
- Link the data to strokes, not just to plaques
- Use the > sign carefully: the highest-risk group is thicker than 1.2 mm
- Only 12 people are in the highest-risk group, but the study itself was large (over 3000 people)
- A thick wall may already be the result of a plaque, and a plaque doesn’t always lead to a stroke
After a heart attack, part of the heart muscle can be damaged. A scientist compared a damaged heart with a healthy heart.
For each heart, the scientist found:
- the mean volume of blood in a full ventricle, just before it contracts (BVB)
- the mean ejection fraction (EF), the proportion of the blood in a full ventricle that is pumped out in one heartbeat.
EF = stroke volumeBVB
Table 1
| Heart | BVB / cm³ | EF |
|---|---|---|
| Healthy | 125 | 0.60 |
| Damaged | 140 | 0.34 |
Calculate the percentage change in stroke volume of the damaged heart compared with the healthy heart.
Answer = ________ %
(2 marks) Revise this topic ↗
Hint
Rearrange the equation to find each stroke volume. For a percentage change, which heart’s value goes on the bottom?
Mark Scheme
−36.5% (2 marks)
Working: stroke volume = EF × BVB; healthy = 0.60 × 125 = 75.0 cm³; damaged = 0.34 × 140 = 47.6 cm³; (47.6 − 75.0) ÷ 75.0 × 100 = −36.5%
If the answer is wrong, 1 mark for any of:
- 47.6 (stroke volume of the damaged heart)
- 75 (stroke volume of the healthy heart)
- 27.4 (the difference between them)
Also accepted / rejected
Also accepted
- 36.5, 36.53, 37 or 40, positive or negative (points 1 and 2)
Tips
- Rearrange EF to find each stroke volume: stroke volume = EF × BVB
- Divide the difference by the healthy heart’s stroke volume (the starting value); dividing by the damaged heart’s gives −57.6%
- Round sensibly: −36.53 is −36.5 to 3 significant figures
Courtship in the three-spined stickleback involves male fish:
- performing a zigzag dance to attract sexually active females
- leading a female to his nest to start mating
- chasing females away when the male is not sexually active.
In a control population of 650 sexually active males, each male showed only one of these behaviours.
Table 1
| Behaviour | Percentage of males |
|---|---|
| Zigzag dance | 91 |
| Chasing females away | 3 |
Calculate the number of males in this population that led a female to the nest.
Answer = ________ males
(1 mark) Revise this topic ↗
Hint
There are three behaviours, but only two are in the table. What percentage of males is left over?
Mark Scheme
39 males (1 mark)
Working: 100 − 91 − 3 = 6%; 6% of 650 = 39
Tips
- Include all three behaviours: 100 − 91 − 3 = 6%
- Give a number of males, not a percentage
Courtship in the three-spined stickleback involves male fish:
- performing a zigzag dance to attract sexually active females
- leading a female to his nest to start mating
- chasing females away when the male is not sexually active.
Scientists were studying courtship in a tank containing only sexually active male sticklebacks. Very few of the males led a female to their nest.
Suggest one change the scientists could make so that more of the males lead a female to their nest.
(1 mark) Revise this topic ↗
Hint
What triggers a male to lead a female to his nest?
Mark Scheme
Add (sexually active) females (1 mark)
Tips
- Adding sexually active females triggers this behaviour; adding more males, food or hormones doesn’t
Toxoplasma gondii is a single-celled parasite. Scientists looked at T. gondii cells with an electron microscope and concluded that it is a eukaryote.
Other than the Golgi apparatus, name one structure the scientists could have seen that shows T. gondii is a eukaryote.
(1 mark) Revise this topic ↗
Hint
Which structures are found in eukaryotic cells but never in prokaryotic cells?
Mark Scheme
Any membrane-bound organelle, e.g. nucleus (or nuclear envelope), mitochondrion, rough endoplasmic reticulum or vesicles (1 mark)
Also accepted / rejected
Also accepted
- Lysosomes, nuclear pores, or 80S (larger) ribosomes
Not accepted
- Nucleolus, smooth endoplasmic reticulum or cell-surface membrane
Tips
- Name a structure found only in eukaryotic cells, such as the nucleus or mitochondria
- Don’t give structures that prokaryotes also have (cell-surface membrane, ribosomes on their own) or structures of plants or bacteria (cell wall, vacuole, plasmid)
Schistosomiasis is a disease caused by parasitic worms. There are about 240 million cases worldwide.
- 90% of cases are in Africa. Schistosoma japonicum is not found in Africa, so it causes none of these cases.
- Outside Africa, S. japonicum causes 30% of cases.
Use this information to calculate the number of cases worldwide caused by S. japonicum.
Answer = ________ cases
(1 mark) Revise this topic ↗
Hint
How many cases are outside Africa? What is 30% of that number?
Mark Scheme
7 200 000 (7.2 million) cases (1 mark)
Working: cases outside Africa = 10% of 240 million = 24 million; 30% of 24 million = 7.2 million
Also accepted / rejected
Also accepted
- Any correct equivalent, e.g. 7.2 × 10⁶
Tips
- Work out the cases outside Africa first (10% of 240 million = 24 million), then take 30% of that
- Don’t take 30% of the total, or add the two percentages together
Diphtheria is caused by a bacterium that releases a toxin. The toxin damages cells in the throat and heart. Not everyone infected with the bacterium becomes ill.
Scientists measured the concentration of anti-toxin antibody in the blood of three groups of people:
- people infected who had no symptoms
- people infected who had symptoms
- people who were not infected.
Figure 1 shows their results.
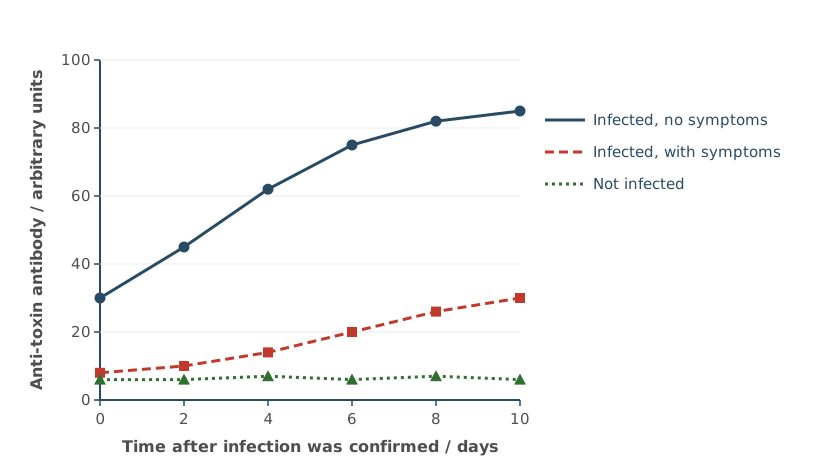
Anti-toxin antibodies can be made in horses and injected into patients. This gives passive immunity.
Use Figure 1 to suggest how the injected antibody would work, and which people should be given it.
You do not need to describe clonal selection or memory cells in your answer.
(3 marks) Revise this topic ↗
Hint
What does an anti-toxin antibody do to the toxin? Which group in Figure 1 has the most antibody and which has the least, and how does that link to becoming ill?
Mark Scheme
- The antibodies bind to the toxin and neutralise it (1 mark)
- Figure 1: infected people without symptoms have the highest antibody concentration, so the antibody prevents illness (1 mark)
- Give it to infected people with symptoms (who have low antibody) (1 mark)
Also accepted / rejected
Also accepted
- The antibodies destroy the toxin, cause agglutination or phagocytosis of it, or stop it binding to and damaging cells (point 1)
- The opposite for point 2: infected people with symptoms have the lowest antibody concentration
- Infected people with a low antibody concentration (point 3)
Not accepted
- Antibodies destroying the bacteria (point 1: it’s the toxin)
Tips
- Say what the antibody does to the toxin (neutralises it), not to the bacteria
- Use Figure 1: infected people without symptoms have the most antibody, so give it to infected people with symptoms (low antibody)
- The antibody levels in Figure 1 are the people’s own response, not from injections
- Passive immunity means the injected antibodies act straight away, without clonal selection or memory cells
Antibodies used as medicines are injected. If they were swallowed, they would be digested in the gut before they could work.
Describe how an antibody would be digested.
(3 marks) Revise this topic ↗
Hint
What type of molecule is an antibody? Which enzymes digest it, and where does each one act?
Mark Scheme
Max 3 marks
- Hydrolysis of peptide bonds (1 mark)
- Endopeptidases break peptide bonds within the polypeptide (1 mark)
- Exopeptidases break the peptide bonds at the ends (1 mark)
- Dipeptidases (membrane-bound) break dipeptides into amino acids (1 mark)
Also accepted / rejected
Also accepted
- “Hydrolyse” or “act on” for break (points 2 to 4)
- “Terminal bonds” for bonds at the ends (point 3)
Not accepted
- Swapping endopeptidases and exopeptidases
Tips
- An antibody is a protein, so it is digested by proteases
- Hydrolysis breaks the peptide bonds between amino acids, not the amino acids themselves
- Endopeptidases act on bonds within the chain, exopeptidases on the end bonds; dipeptidases on the epithelial cell membranes break dipeptides into amino acids
- Stomach acid, amylase and absorption aren’t asked for
A student cut a well (a hole) in the agar of a plate of bacteria. The well had a diameter of 8 mm. She needed to put 80 mm³ of clove oil into the well.
Calculate the minimum depth of the well needed to hold 80 mm³ of clove oil.
Use this equation, with π = 3.14:
Volume of a cylinder = πr² × l
Show your working.
Answer = ________ mm
(2 marks) Revise this topic ↗
Hint
Is the 8 mm a radius or a diameter? Rearrange the equation to find l.
Mark Scheme
1.59 mm (2 marks)
Working: r = 4 mm; πr² = 3.14 × 4² = 50.24 mm²; l = 80 ÷ 50.24 = 1.59 mm
If the answer is wrong, 1 mark for any of:
- 50.24 (or 50.2 or 50.3), the area of the end of the well
- 0.398 (using the diameter instead of the radius)
Also accepted / rejected
Also accepted
- 1.6 or 2 (correct rounding)
- 1.5915 (using π on a calculator)
Tips
- Use the radius (4 mm), not the diameter (8 mm)
- Rearrange: depth = volume ÷ πr² = 80 ÷ 50.24
- Show your working; the area (50.24) still earns a mark if the final answer is wrong
A student tested the effect of clove oil on five species of bacteria. For each species, she measured the diameter of the clear zone around a disc of clove oil and around a disc of a positive control, to the nearest mm.
Table 1
| Bacterial culture | Diameter of clear zone with clove oil / mm | Diameter of clear zone with positive control / mm |
|---|---|---|
| Escherichia coli | 14 | 18 |
| Staphylococcus aureus | 19 | 22 |
| Bacillus subtilis | 16 | 20 |
| Pseudomonas fluorescens | 11 | 15 |
| Micrococcus luteus | 15 | 20 |
| Median | ||
| Mean |
Complete Table 1 by giving the median and the mean diameter for each column.
(1 mark) Revise this topic ↗
Hint
What must you do to the values before you can find the median? Give your answers to the same precision as the measurements.
Mark Scheme
| Clove oil | Positive control | |
|---|---|---|
| Median | 15 | 20 |
| Mean | 15 | 19 |
All four values correct (1 mark)
Tips
- Put the values in order before finding the median: for clove oil, 11, 14, 15, 16, 19 gives 15, not 16
- Give the values to the same number of significant figures as the data
Before DNA sequencing was available, bacteria were classified using features seen with an optical microscope, including the number of flagella on each cell and where they were attached.
Some facts about bacterial flagella:
- species in the same genus often have the same pattern of flagella
- flagella break off cells easily
- flagella take up stains poorly
- a flagellum can point in any direction from the cell.
Consider how accurate this method of classification was, and its limitations.
(3 marks) Revise this topic ↗
Hint
Use each fact in turn: what problem would it cause when looking down an optical microscope? And what about the microscope itself?
Mark Scheme
Max 3 marks
- It can’t tell species apart (in the same genus) (1 mark)
- An optical microscope has low resolution (1 mark)
- Flagella may be broken off or missing, or other structures mistaken for flagella (1 mark)
- Flagella are hard to stain, so they may not be seen (1 mark)
- Flagella pointing out of the plane of view may not be seen (1 mark)
- Not all bacteria have flagella (1 mark)
Also accepted / rejected
Not accepted
- “Low magnification” (point 2: it’s resolution)
- “Hard to stain” without saying they can’t be seen (point 4)
Tips
- Use the information: species in the same genus share flagella patterns, so they can’t be told apart
- Say optical microscopes have low resolution, not low magnification
- Explain each limitation: flagella break off, are hard to stain so aren’t seen, or point out of the plane of view
Carbon monoxide (CO) binds to haemoglobin to form carboxyhaemoglobin (COHb). To avoid long-term harm, a health agency aims to keep COHb below 2.5% of a person’s haemoglobin.
The agency recommends that people should not breathe:
- air with more than 40 mg m⁻³ CO for more than 1 hour
- air with more than 12 mg m⁻³ CO for more than 8 hours.
Scientists used a computer model to predict the COHb of an adult and a child, sitting at rest, breathing air at each of these limits. Figure 1 shows their predictions.
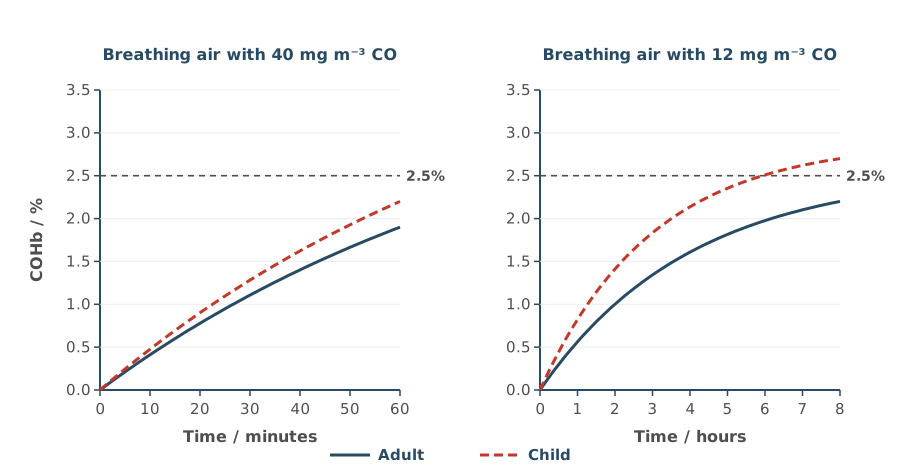
The scientists concluded that the agency’s limits for CO should be lowered.
Evaluate the scientists’ conclusion.
(3 marks) Revise this topic ↗
Hint
Compare each curve with the 2.5% line. Which ones cross it, and which stay below? Then think about who the predictions apply to, and whether the differences have been tested.
Mark Scheme
Max 3 marks: must include point 1 or point 2
Supports the conclusion
- A child breathing the 8-hour limit (12 mg m⁻³) goes above 2.5% COHb (about 2.7% after 8 hours) (1 mark)
Doesn’t support the conclusion
- The adult at both limits, and the child at the 1-hour limit, stay below 2.5% COHb (1 mark)
Limitations
- Only for people at rest; the effect of exercise is unknown (1 mark)
- People vary, e.g. in size, age or sex (1 mark)
- No statistical test, so we don’t know if the differences are significant (1 mark)
- The effect on people with respiratory disease, or on smokers, is unknown (1 mark)
- It may not be possible to lower CO in the air below 12 mg m⁻³ (1 mark)
Also accepted / rejected
Also accepted
- A named respiratory disease, e.g. asthma (point 6)
Tips
- Compare each curve with the 2.5% line: only the child at the 8-hour limit goes above it, so only this supports lowering a limit
- Say clearly whether each piece of data supports the conclusion or not
- Then give limitations: only for people at rest, people vary, and no statistical test was done
Scientists tested drug Z as a possible treatment for cancer. Drug Z stops cytokinesis by inhibiting an enzyme, enzyme E.
Figure 1 shows drawings of cancer cells seen with an optical microscope. One sample was treated with drug Z and one was not.
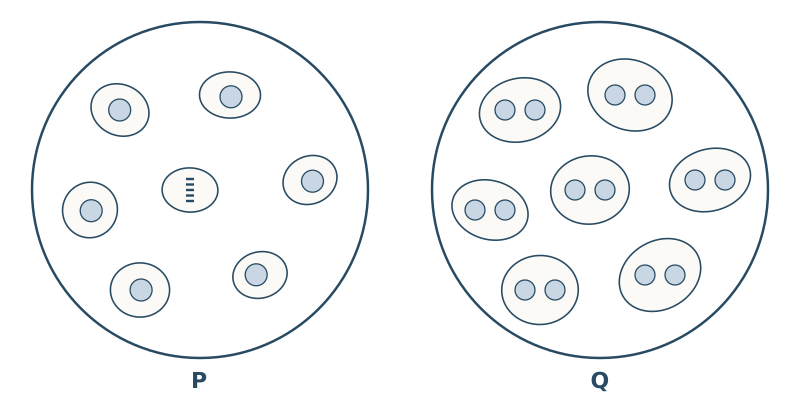
Explain why the cells in drawing Q must be the ones treated with drug Z.
(2 marks) Revise this topic ↗
Hint
Count the nuclei in each cell in Q. Which step of cell division has not happened?
Mark Scheme
- The cells in Q have two nuclei (1 mark)
- Because cytokinesis was prevented: the cytoplasm didn’t divide after the nucleus divided (1 mark)
Also accepted / rejected
Also accepted
- The cells stopped at telophase (point 1)
- The cell-surface membrane didn’t pinch in to form two cells (point 2)
Tips
- Say the cells in Q have two nuclei, and link this to cytokinesis being prevented
- The two round shapes in each cell are nuclei, not separate cells
Drug Z is a non-competitive inhibitor of enzyme E.
Suggest how drug Z makes enzyme E inactive.
(3 marks) Revise this topic ↗
Hint
Where does a non-competitive inhibitor bind? What does that do to the active site?
Mark Scheme
- Drug Z binds to enzyme E at a site other than the active site (1 mark)
- This changes the tertiary structure, so the active site changes shape (1 mark)
- The active site is no longer complementary to the substrate, so fewer enzyme-substrate complexes form (1 mark)
Also accepted / rejected
Also accepted
- “Allosteric site” (point 1)
- “The substrate can no longer bind (fit) to the active site” (point 3)
Not accepted
- Drug Z binding to the substrate (point 1)
- “Loss of specificity” without saying the active site is no longer complementary (point 3)
Tips
- A non-competitive inhibitor binds to the enzyme at a site other than the active site (an allosteric site), not to the substrate
- This changes the tertiary structure, so the active site changes shape
- Finish the chain: the active site is no longer complementary, so the substrate can’t bind
Scientists tested drug Z as a possible treatment for cancer. Drug Z inhibits an enzyme, enzyme E. Enzyme E is needed for cytokinesis, and it also stops cells from dying.
The scientists grew 4000 cancer cells in a dish with no drug Z (the control), and 4000 cells in each of eight dishes with different concentrations of drug Z. After 72 hours, they counted the cells in each dish.
Figure 1 shows their results.
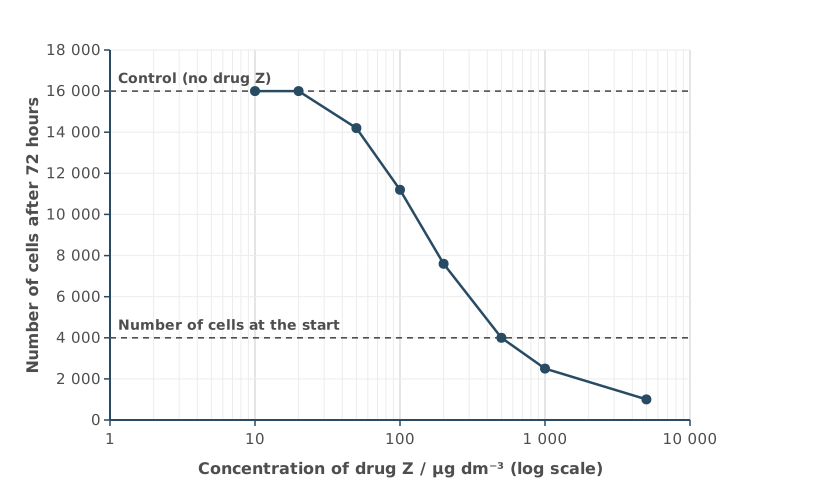
Use all the information to explain the results in Figure 1.
(3 marks) Revise this topic ↗
Hint
Split the graph into three parts: low, middle and high concentrations. Compare the count with the two dashed lines. For each part, what is happening to enzyme E, to cytokinesis and to cell death?
Mark Scheme
- At the lowest concentrations (10 to 20 µg dm⁻³), enzyme E is not inhibited, so the number of cells is the same as the control (1 mark)
- As the concentration increases, more enzyme E is inhibited, so there is less cytokinesis and more cell death (1 mark)
- At the highest concentrations (above 500 µg dm⁻³), all enzyme E is inhibited, so cells die (fewer than the 4000 cells at the start) (1 mark)
Also accepted / rejected
Also accepted
- Drug Z having no effect at the lowest concentrations (point 1)
- “Mitosis” or “cell division” for cytokinesis
- No change in cell number at 500 µg dm⁻³ (point 2)
Tips
- Explain, don’t just describe: link each part of the graph to enzyme E being inhibited (less cytokinesis, more cell death)
- Describe the trend: as the concentration increases, more enzyme E is inhibited
- Read the log scale carefully: the count equals the control at 10 to 20 µg dm⁻³, and there is no growth (still 4000 cells) at 500 µg dm⁻³
Scientists tested drug Z as a possible treatment for cancer. Drug Z inhibits an enzyme, enzyme E. Enzyme E is needed for cytokinesis, and it also stops cells from dying.
The scientists grew 4000 cancer cells in a dish with no drug Z (the control), and 4000 cells in each of eight dishes with different concentrations of drug Z. After 72 hours, they counted the cells in each dish.
Figure 1 shows their results.
Each dish contained 0.02 dm³ of drug Z solution.
Calculate the increase in the mass of drug Z (in µg) needed to go from the same number of cells as the control to no growth (4000 cells after 72 hours).
Show your working.
Answer = ________ µg
(2 marks) Revise this topic ↗
Hint
Read the two concentrations from the graph (watch the log scale). Find the difference, then use the volume to turn a concentration into a mass.
Mark Scheme
9.6 µg (accept 9.6 to 9.8) (2 marks)
Working: increase in concentration = 500 − 20 = 480 µg dm⁻³; mass = 480 × 0.02 = 9.6 µg
If the answer is wrong, 1 mark for any of:
- 20 (or 10) and 500 read from the graph
- 480 (or 490), the increase in concentration
- × 0.02 (turning a concentration into a mass)
Also accepted / rejected
Also accepted
- 9.8 µg, from 10 and 500 (any value from 10 to 20 for the first reading)
Tips
- Read the log scale correctly: the count equals the control at 10 to 20 µg dm⁻³ and is 4000 (no growth) at 500 µg dm⁻³
- Find the increase in concentration, then multiply by the volume (0.02 dm³) to get the mass
Zika is a disease caused by the Zika virus. Figure 1 shows a test that detects antibodies against the Zika virus in a patient’s blood.
The instructions say that if no line appears at C, the result should be ignored and the test repeated.
Suggest why.
(1 mark) Revise this topic ↗
Hint
To make a line at C, what must have travelled along the strip? Where is C compared with T?
Mark Scheme
A line at C shows that the blood sample has moved along the strip past line T; with no line, the sample may not have reached T (1 mark)
Also accepted / rejected
Also accepted
- The sample and the anti-human antibodies have moved along the test strip
Not accepted
- Only explaining why a colour forms at C
Tips
- Explain what the control line proves: the sample has moved past line T to reach C
- Explaining only why a colour forms at C misses the point
To make a monoclonal antibody for a diagnostic test, scientists injected a mouse with an antigen. They then fused B cells from the mouse with cancer cells.
Suggest why these fused cells can produce monoclonal antibodies continuously.
(2 marks) Revise this topic ↗
Hint
The fused cell has properties from both cells. What does each one contribute?
Mark Scheme
- The cancer cell part means the fused cells divide rapidly (indefinitely) (1 mark)
- The B cell part means the fused cells produce the antibody (1 mark)
Also accepted / rejected
Also accepted
- “Hybridoma” for fused cell
- “Divide by mitosis” (point 1)
- “Plasma cells” for B cells (point 2)
Tips
- Give both parts: the cancer cell part divides rapidly, and the B cell part produces the antibody
- T cells and the immune response in the mouse aren’t relevant
Zika is a disease caused by the Zika virus. Many other diseases spread by mosquitoes cause the same early symptoms, so Zika can be hard to identify. Identifying it early is important, especially in pregnant women.
Scientists compared three tests for Zika:
- a laboratory test: a blood sample is sent from the clinic to a laboratory
- the test currently used in clinics
- a new test to be used in clinics, which detects antibodies against the Zika virus.
They tested blood samples from people known to have Zika, at different times after their symptoms started. Table 1 shows the number of samples that tested positive out of 20 at each time.
Table 1
| Time after symptoms started / days | Laboratory test | Current clinic test | New clinic test |
|---|---|---|---|
| 1–2 | 18 | 4 | 9 |
| 3–4 | 17 | 9 | 13 |
| 5–6 | 12 | 14 | 15 |
| 7–8 | 8 | 17 | 17 |
The scientists recommend that the new test is used to identify Zika in all countries.
Discuss this recommendation. Use all the information given.
(3 marks) Revise this topic ↗
Hint
Compare the new test with both other tests, early and late. Add up the totals. Then think about practical points for clinics in different countries.
Mark Scheme
Max 3 marks; max 2 from points 4 to 6
- In the first 4 days, the new test detects more than the current test but fewer than the laboratory test (1 mark)
- From day 5, the new test is as good as (or better than) the current test, and better than the laboratory test (1 mark)
- In total, the new test (54) detects more than the current test (44) and almost as many as the laboratory test (55) (1 mark)
- The new test is likely to be quicker (1 mark)
- The new test is likely to be cheaper (1 mark)
- Some countries have few laboratories, or few people trained to use them (1 mark)
Also accepted / rejected
Also accepted
- Correct figures or percentages from Table 1 to support points 1 to 3, e.g. 9 out of 20 (45%) compared with 4 (20%) and 18 (90%) on days 1–2
- “Detects more” or “more effective” for “better”
- “More efficient” for quicker (point 4)
Tips
- Compare all three tests, including the current test: early on, the new test detects more than the current test but fewer than the laboratory test
- Use totals or percentages from Table 1 to back up each comparison
- Then consider practical points: the new test is likely to be quicker and cheaper, and some countries have few laboratories
Also accepted