The Chi-Squared Test
What you need to know (from the AQA specification)
What you need to know (from the AQA specification)
Use of the chi-squared (Χ²) test to compare the goodness of fit of observed phenotypic ratios with expected ratios.
Students could use the Χ² test to investigate the significance of differences between expected and observed phenotypic ratios.
The chi-squared (χ²) test tells you whether the difference between your observed results and the expected ratio is small enough to be due to chance, or whether it’s significant.
Use the χ² test when your data are categorical (counts of individuals in each category, e.g. phenotypes) and you want to compare observed numbers with expected numbers.
You don’t need to memorise the formula, χ² = Σ (O − E)² ÷ E, but you do need to be able to apply it, so work through the examples below. You’ll be given a table of critical values.
Worked example: do the results of a dihybrid cross fit 9 : 3 : 3 : 1?
Two pea plants that are heterozygous for both genes (RrYy × RrYy) are crossed, so you’d expect a 9 : 3 : 3 : 1 ratio. A student counts 556 offspring: 315 round yellow, 108 round green, 101 wrinkled yellow and 32 wrinkled green. Do the results fit the expected ratio?
1. State the null hypothesis
There is no significant difference between the observed numbers and the expected 9 : 3 : 3 : 1 ratio.
2. Work out the expected numbers
The ratio adds up to 16 (9 + 3 + 3 + 1), so multiply the total by each fraction. For round yellow, 556 × 9/16 = 312.75.
3. Calculate (O − E)² ÷ E for each phenotype, then add them up
| Phenotype | Observed (O) | Expected (E) | O − E | (O − E)² ÷ E |
|---|---|---|---|---|
| Round yellow | 315 | 556 × 9/16 = 312.75 | 2.25 | 0.02 |
| Round green | 108 | 556 × 3/16 = 104.25 | 3.75 | 0.13 |
| Wrinkled yellow | 101 | 556 × 3/16 = 104.25 | −3.25 | 0.10 |
| Wrinkled green | 32 | 556 × 1/16 = 34.75 | −2.75 | 0.22 |
| χ² = | 0.47 |
4. Work out the degrees of freedom
There are 4 phenotypes, so degrees of freedom = 4 − 1 = 3.
5. Find the critical value
In the exam you’ll be given a table like this. Find the row for 3 degrees of freedom and the column for p = 0.05:
| Degrees of freedom | Probability (p) | ||
|---|---|---|---|
| 0.10 | 0.05 | 0.01 | |
| 1 | 2.71 | 3.84 | 6.64 |
| 2 | 4.61 | 5.99 | 9.21 |
| 3 | 6.25 | 7.82 | 11.35 |
| 4 | 7.78 | 9.49 | 13.28 |
So the critical value is 7.82.
6. Write the conclusion
0.47 is less than 7.82, so the probability that the difference between observed and expected is due to chance is more than 5%. The difference is not significant, so accept the null hypothesis. The results fit a 9 : 3 : 3 : 1 ratio.
If χ² is bigger than the critical value, the probability that the difference is due to chance is less than 5%. The difference is significant, so you reject the null hypothesis.
A monohybrid cross gave 72 tall and 28 short plants. Is this significantly different from a 3 : 1 ratio? (Critical value with 1 degree of freedom at p = 0.05 is 3.84)
A monohybrid cross gave 72 tall and 28 short plants. Is this significantly different from a 3 : 1 ratio? (Critical value with 1 degree of freedom at p = 0.05 is 3.84)
- Total = 100, so expected = 75 tall and 25 short
- Tall: (72 − 75)² ÷ 75 = 9 ÷ 75 = 0.12
- Short: (28 − 25)² ÷ 25 = 9 ÷ 25 = 0.36
- χ² = 0.12 + 0.36 = 0.48
- 0.48 is less than 3.84, so the probability that the difference is due to chance is more than 5%. The difference is not significant, and the results fit a 3 : 1 ratio
Tip
Degrees of freedom is the number of categories (phenotypes) minus 1,. A 9 : 3 : 3 : 1 ratio has 4 categories, so 3 degrees of freedom.
Exam Question Practice
This question tests how to interpret a chi-squared value. Try it before opening the answer.
If two diploid (2n) gametes fuse at fertilisation, it can result in the growth of a tetraploid plant which has 4 copies of each chromosome.
Red clover is a plant grown to produce cattle feed. Tetraploid red clover plants produce a higher yield than diploid red clover plants.
Whether a red clover plant produces 2n gametes is genetically controlled.
Scientists investigated the possibility of breeding red clover plants that only produced 2n gametes.
- In breeding cycle 0, they grew red clover plants and identified plants that produced 2n gametes.
- In breeding cycle 1, they used the plants producing 2n gametes to produce offspring.
- In breeding cycles 2 and 3, they identified plants producing 2n gametes and used these to produce offspring.
Their results are shown in Table 3.
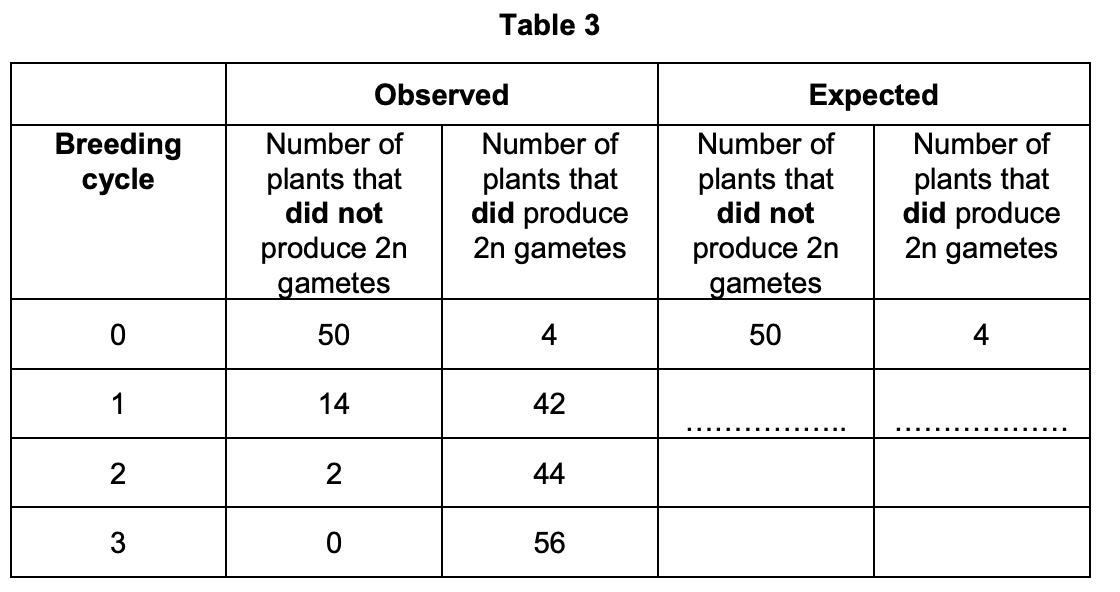
The scientists used the following null hypothesis.
‘The proportion of plants that produce 2n gametes will not change from one breeding cycle to the next.’
The scientists tested their null hypothesis using the chi-squared statistical test.
After 1 cycle their calculated chi-squared value was 350
The critical value at P=0.05 is 3.841
What does this result suggest about the difference between the observed and expected results and what can the scientists therefore conclude?
(2 marks)
Hint
Is 350 bigger or smaller than the critical value? What does that tell you about the probability that the difference is due to chance, and about the null hypothesis?
Mark Scheme
Max 2 marks
- There is a less than 0.05/5% probability that the difference(s) (between observed and expected) occurred by chance (1 mark)
- Calculated value is greater than critical value so the null hypothesis can be rejected (1 mark)
- (The scientists can conclude that) the proportion of plants that produce 2n gametes does change from one breeding cycle to the next (1 mark)
Comments from mark scheme
Tips from examiner reports
Tips from the examiner report
- It is the difference between observed and expected that is (or isn’t) due to chance, not the ‘results’
- Compare the calculated value with the critical value, then say what that means for the null hypothesis
1. Reject ‘results (without reference to difference) occurring by chance’. Overall max 1 with this statement.
1. Accept ‘there is a greater than 0.95/95% probability that the difference did not occur by chance’.
1. and 2. Ignore ‘difference is significant’
2. Do not accept ‘P value’ for ‘critical value’.