Exam-style questions written in the same style as AQA A-level Biology papers.
Filter by unit or topic, or press Practice to work through the questions one at a time.
Want AQA’s own past paper questions by topic? I can’t include them on this site for copyright reasons. Instead, you can download my list of every question from 2017 to 2025, tagged by topic, and find the papers themselves on AQA’s website.
ATP is the immediate source of energy for cells.
Describe the structure of ATP, and outline how named enzymes break down and resynthesise it.
(4 marks)
Hint
What three components make up ATP? What happens to water in the reactions that make and break ATP?
Mark Scheme
- ATP is made of ribose, adenine and three phosphate groups (1 mark)
- ATP hydrolase breaks ATP down into ADP + Pi in a hydrolysis reaction (1 mark)
- ATP synthase makes ATP from ADP + Pi (1 mark)
- In a condensation reaction (1 mark)
Also accepted / rejected
Tips
- ATP structure = adenosine (adenine + ribose) + 3 phosphate groups: don’t just say “ADP + Pi”
- Say ribose specifically, not just “pentose sugar”
- Hydrolysis of ATP uses water and is catalysed by ATP hydrolase: don’t confuse hydrolysis with condensation
- Don’t spend time describing ATP as an “immediate energy source” when the question asks about structure and reactions
Starch and cellulose are both found in plant cells.
Compare and contrast the structures of these two molecules.
(6 marks)
Hint
Compare the monomers, bonds, shape and branching. What do they have in common?
Mark Scheme
Max 6 marks: must include at least one similarity (point 1, 2 or 3)
Similarities
- Both are polysaccharides (polymers of glucose) (1 mark)
- Both have glycosidic bonds (1 mark)
- Both contain carbon, hydrogen and oxygen (1 mark)
Differences
- Starch is made of α-glucose; cellulose of β-glucose (1 mark)
- Starch is coiled (helical); cellulose is straight (1 mark)
- Starch is branched; cellulose is unbranched (1 mark)
- Cellulose forms microfibrils; starch doesn’t (1 mark)
- Starch has 1–6 glycosidic bonds; cellulose doesn’t (1 mark)
Also accepted / rejected
Also accepted
- Starch is two molecules (amylose and amylopectin), cellulose is one (point 8)
Not accepted
- Separate descriptions of each molecule that aren’t compared
Tips
- Write direct comparisons (“starch is α-glucose but cellulose is β-glucose”); separate lists of features score nothing
- Include a similarity (both polysaccharides of glucose, both have glycosidic bonds) to reach full marks
- Cellulose forms microfibrils, not myofibrils (those are in muscle)
- Stick to structure; don’t explain functions
Mannan is a polysaccharide found in some plant cell walls. The mannan monomer is β-mannose, a hexose sugar with the same chemical formula as glucose.
Figure 1 shows the monomer that forms mannan and part of the mannan polymer.
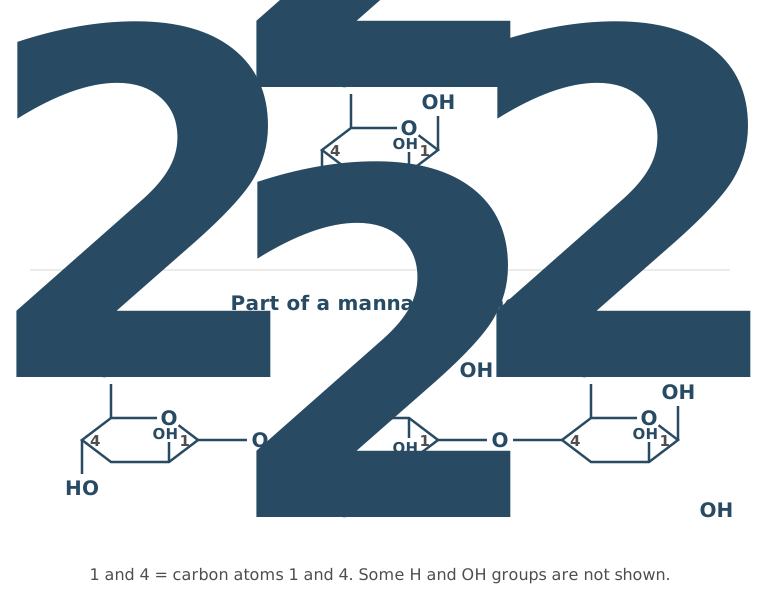
Mannan has a similar structure to cellulose.
Use Figure 1 to describe three ways the structure of mannan is similar to the structure of cellulose.
(3 marks)
Hint
Focus on structural features shown in the diagram. Are the monomers α or β? What type of bond joins them? How are the monomers arranged?
Mark Scheme
Max 3 marks
- Alternate monomers are upside down (rotated 180°) (1 mark)
- The monomers are joined by glycosidic bonds (1 mark)
- The chains are straight (unbranched) (1 mark)
- The bonds are 1–4 glycosidic bonds (1 mark)
- Both are made of β monomers (1 mark)
Also accepted / rejected
Not accepted
- Mentioning 1–6 bonds (cancels point 4)
- “Both are polysaccharides” or “both contain C, H and O” (no mark)
Tips
- Use features shown in Figure 1: β monomers, glycosidic (1–4) bonds, unbranched chains, and alternate monomers flipped
- Say “monomer”, not “molecule”
- Don’t mention 1–6 bonds (that’s starch), which cancels the 1–4 mark
- Hydrogen bonds between chains aren’t shown in the figure, so don’t include them
Honey contains glucose, fructose and a small amount of sucrose.
A student tested a solution of honey for reducing sugars.
Describe how the student would test the honey solution for reducing sugars. Then give the result they would expect and explain why.
(3 marks)
Hint
What reagent is used? What conditions are needed? What colour shows a positive result? Which sugars in the sample would actually react?
Mark Scheme
- Heat the sample with Benedict’s solution (1 mark)
- A red colour (or precipitate) (1 mark)
- Because glucose and fructose are reducing sugars (1 mark)
Also accepted / rejected
Also accepted
- Green, yellow, orange or brown for red (point 2)
Not accepted
- Heating with acid first (that is the test for non-reducing sugars)
- Saying sucrose is detected (point 3)
Tips
- Say “heat” with Benedict’s reagent; “use a water bath” on its own doesn’t show it is heated
- Don’t describe the non-reducing sugar test (e.g. boiling with acid)
- Explain the positive result: glucose and fructose are reducing sugars. Sucrose is a non-reducing sugar, so it isn’t detected
- Give one expected result (e.g. red); don’t list every possible colour
- Sucrose being present doesn’t stop the colour change, because glucose and fructose are still there
In the early 1900s, a group of scientists investigated enzyme action.
After studying their results, the scientists reached the following conclusions:
Enzymes speed up reactions at body temperature. They do this without binding to the substances that react. Enzymes are not used up or changed by the reactions they speed up.
Our current understanding of enzyme action is based on the induced-fit model.
Compare these early conclusions with our current understanding of enzyme action. Give similarities and differences.
(4 marks)
Hint
Compare the early conclusions with the induced-fit model. What do both agree on about what enzymes do? What does the modern model say about the substrate and the active site that the early scientists denied?
Mark Scheme
Similarities
- Enzymes are not changed by the reaction, so they can be reused (1 mark)
- Enzymes speed up reactions at body temperature, or lower the activation energy (1 mark)
Differences
- In the induced-fit model, the active site changes shape (1 mark)
- The enzyme does combine with the substrate, forming an enzyme-substrate complex (1 mark)
Also accepted / rejected
Also accepted
- “The active site and substrate bind” or “E-S complex” (point 4)
Tips
- Say the active site changes shape when the substrate binds (induced fit); “the tertiary structure changes” is not precise enough
- Be specific about similarities. “Both cause reactions” is too vague. Say both are unchanged by the reaction and allow reactions at normal temperatures
- Show understanding in your own words rather than copying phrases from the passage
- Use the word “substrate”, not “substance”
What earns marks
- Similarities are usually answered much better than differences
- Stating that an enzyme-substrate complex forms earns a difference mark
An enzyme is found in two species of bacteria, species X and species Y. The two forms of the enzyme catalyse the same reaction, but they have different amino acid sequences. Both are proteins with a quaternary structure.
Scientists investigated the activity of the two enzymes at pH 6.0 and pH 7.0.
Describe what the scientists should put in the control tubes in this investigation.
(3 marks)
Hint
A control should show what happens without active enzyme. What else in the tube must stay the same?
Mark Scheme
Max 3 marks
- The same volume of each buffer (1 mark)
- The same concentration of substrate (1 mark)
- The same concentration of denatured (boiled) enzyme (1 mark)
- If none of points 1 to 3 is given: buffer, substrate and no enzyme (or water instead of enzyme) (1 mark)
Also accepted / rejected
Also accepted
- “pH solution” for buffer (point 1)
Tips
- The control has everything except active enzyme: the same volume of each buffer, the same concentration of substrate, and the same concentration of denatured (boiled) enzyme
- Why each is needed: the buffer keeps the pH the same as in the test tubes, the same substrate concentration means substrate isn’t a variable, and boiled enzyme keeps everything the same except that the enzyme can’t work, so any change in the control isn’t caused by active enzyme
- Say “buffer”, not “the same pH”
- Don’t change the independent variable: no different enzyme, pH, substrate or inhibitor
Figure 1 shows a glycerol molecule and a fatty acid. In a triglyceride, each fatty acid is joined to glycerol by a bond.
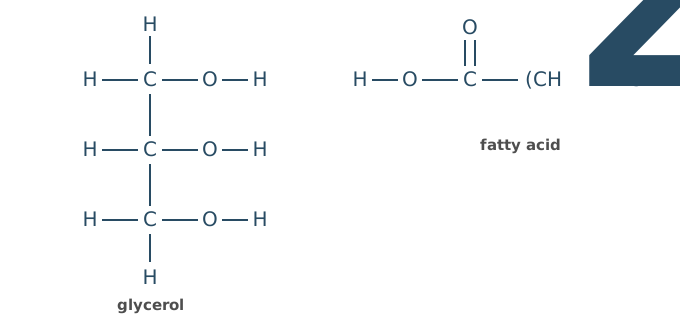
On Figure 1, draw a circle around the atoms that are removed from each molecule when this bond forms.
Name the bond, and the type of reaction that forms it.
(3 marks)
Hint
What small molecule is released when glycerol and a fatty acid join? Which atoms from each molecule make up that molecule?
Mark Scheme
- Circle the H of one of glycerol’s OH groups and the OH of the fatty acid’s COOH group (these form water) (1 mark)
- An ester bond (1 mark)
- A condensation reaction (1 mark)
Also accepted / rejected
Also accepted
- Circling the OH from glycerol and the H from the fatty acid’s OH group (point 1)
Tips
- Name the bond as an ester bond, not a glycosidic bond
- Circle the OH of the fatty acid’s carboxyl group and the H of an OH group on glycerol; together they form the water that is removed
- Don’t circle an H from a C–H group of glycerol, and don’t circle an OH on both molecules
What earns marks
- Most students know the bond is formed by a condensation reaction
Phospholipids are one of the main components of the cell-surface membrane. There is water on both sides of the membrane (in the cytoplasm inside the cell, and in the fluid outside the cell).
Describe and explain how the phospholipid molecules are arranged in the membrane.
(2 marks)
Hint
Think about which part of a phospholipid is attracted to water and which part is repelled by it, and how this makes the molecules arrange themselves with water on both sides of the membrane.
Mark Scheme
- The phospholipids form a bilayer in the cell-surface membrane (1 mark)
- This is because the hydrophilic phosphate heads are attracted to the water on both sides, so they face outwards, and the hydrophobic fatty acid tails are repelled by water, so they face inwards (1 mark)
Also accepted / rejected
Also accepted
- A correctly labelled diagram of a bilayer (point 1)
- Either half of point 2 on its own (heads attracted to water, or tails repelled by water)
- “Polar” for hydrophilic and “non-polar” for hydrophobic
Tips
- Explain why a bilayer forms, not just that it is one. The phosphate heads are hydrophilic and point towards water, the fatty acid tails are hydrophobic and point away from it
- Double-check which part is which. Heads are hydrophilic and tails are hydrophobic
- Stick to the arrangement; points about permeability or carrier proteins gain no marks
- If you draw a diagram, label it and show where the water is
What earns marks
- Identifying the phospholipid bilayer (the mark most students get)
The melting point is the temperature at which a solid changes into a liquid.
Table 1 shows information about four fatty acids.
Table 1
| Fatty acid | Number of carbon atoms | Number of C=C double bonds | Melting point / °C |
|---|---|---|---|
| A | 18 | 0 | 70 |
| B | 18 | 1 | 13 |
| C | 18 | 2 | −5 |
| D | 18 | 3 | −11 |
Describe the relationship shown in Table 1 between the structure of a fatty acid and its melting point.
(1 mark)
Hint
Consider how double bonds affect the shape of fatty acid chains and how closely they can pack together.
Mark Scheme
As the number of C=C double bonds increases, the melting point decreases (1 mark)
Also accepted / rejected
Also accepted
- The opposite: the more saturated the fatty acid, the higher the melting point
- “As the number of hydrogen atoms increases, the melting point increases”
Tips
- Describe the link using carbon–carbon double bonds: as the number of double bonds increases, the melting point decreases
- If you mention hydrogen, refer to hydrogen atoms, not hydrogen molecules
- Read the question: it asks about melting point, not boiling point
Describe how a protein with a quaternary structure is formed from its monomers.
Do not describe transcription or translation.
(5 marks)
Hint
Describe each level of protein structure and the bonds involved at each level.
Mark Scheme
- Amino acids are joined by peptide bonds (1 mark)
- In condensation reactions (1 mark)
- The secondary structure forms by hydrogen bonding (1 mark)
- The tertiary structure forms by interactions between R groups (1 mark)
- The quaternary structure has more than one polypeptide (held by bonds between them) (1 mark)
Also accepted / rejected
Also accepted
- “α-helix” or “β-pleated sheet” for secondary structure (point 3)
- Named interactions for points 4 and 5: hydrogen bonds, ionic bonds, disulfide bridges, hydrophobic interactions
Not accepted
- “Four polypeptides” for quaternary (it means more than one)
Tips
- Cover all levels of protein structure: primary (amino acids joined by peptide bonds via condensation), secondary, tertiary, quaternary
- Quaternary structure doesn’t always mean four polypeptides: it means more than one polypeptide chain
- Don’t forget to mention condensation reactions and peptide bonds for primary structure
During transcription, RNA polymerase joins free RNA nucleotides together to make a strand of mRNA.
Describe how the nucleotides are joined.
(2 marks)
Hint
Think about the name of the bond formed between adjacent nucleotides and the type of reaction that forms it.
Mark Scheme
- A phosphodiester bond forms between adjacent nucleotides (1 mark)
- By a condensation reaction (1 mark)
Also accepted / rejected
Not accepted
- A bond between complementary bases (e.g. A and U); that is base pairing, not how the nucleotides in the strand are joined
Tips
- Name the phosphodiester bond and say it forms between the phosphate of one nucleotide and the ribose of the next, not between bases or between RNA and DNA
- Don’t confuse phosphodiester bonds with hydrogen bonds
- Answer the question asked. Describing the rest of transcription gains no marks
What earns marks
- Stating the bond is formed by condensation (the mark most students get)
DNA and tRNA are both nucleic acids.
Complete Table 1 to give three differences between a DNA molecule and a tRNA molecule.
Table 1
| DNA | tRNA | |
|---|---|---|
| 1 | ||
| 2 | ||
| 3 |
(3 marks)
Hint
Compare the two molecules on sugar, bases, number of strands, size and shape.
Mark Scheme
Any three rows, each comparing the same feature (3 marks)
| DNA | tRNA | |
|---|---|---|
| 1. | Deoxyribose | Ribose |
| 2. | Double-stranded (double helix) | Single-stranded |
| 3. | Thymine | Uracil |
| 4. | Many nucleotides (long) | Few nucleotides (short) |
| 5. | Linear (double helix) | Clover-leaf shape |
| 6. | No amino acid binding site | Binds an amino acid |
| 7. | No exposed bases | Has an anticodon |
Also accepted / rejected
Not accepted
- Bases written as letters only (T and U)
- A row that doesn’t compare the same feature
Tips
- Make each row a direct comparison, e.g. deoxyribose v ribose, double-stranded v single-stranded
- Write thymine and uracil in full: letters alone score nothing
- Say “double helix”, not just “helix”
- If you give tRNA’s anticodon, the DNA side must be “no exposed bases”
Describe what happens to the chromosomes during metaphase and during anaphase of mitosis.
(4 marks)
Hint
For each stage, think about where the chromosomes are and what they are attached to. What happens at the centromeres to let the chromatids separate?
Mark Scheme
Max 2 marks for metaphase
Metaphase
- The chromosomes line up at the equator (middle) of the cell (1 mark)
- They are attached to the spindle fibres by their centromeres (1 mark)
- Each chromosome is fully condensed, made of two sister chromatids (1 mark)
Anaphase
- The centromeres divide (1 mark)
- The chromatids are pulled to opposite poles (1 mark)
Also accepted / rejected
Also accepted
- “Metaphase plate” for the equator (point 1)
- “Short and thick” for condensed (point 3)
Not accepted
- Homologous chromosomes moving to opposite poles (that’s meiosis)
Tips
- In metaphase, say where the chromosomes are (lined up at the equator) and what holds them there (spindle fibres attached at the centromeres)
- In anaphase, say the centromeres divide and the chromatids are pulled to opposite poles
- Don’t include meiosis events such as homologous chromosomes separating or crossing over
Describe binary fission in bacteria.
(3 marks)
Hint
Think about the two types of DNA in a bacterium that must be copied, and then how the cell splits into two.
Mark Scheme
- The circular DNA is replicated (1 mark)
- The plasmids are replicated (1 mark)
- The cytoplasm divides to produce two daughter cells (1 mark)
Also accepted / rejected
Also accepted
- “Doubles” for replicated (points 1 and 2)
- A new cell-surface membrane forming between the two cells, or “cytokinesis” (point 3)
Not accepted
- “Chromosome” for the circular DNA, or describing mitosis (point 1)
Tips
- Make two separate points about DNA. The circular DNA replicates, and the plasmids replicate. “Genetic material replicates” gets neither mark
- Bacteria divide by binary fission, not mitosis, so don’t describe the stages of mitosis
- Bacteria don’t have membrane-bound organelles, so don’t describe organelles being copied
Viruses can only replicate inside a host cell.
Describe how a virus replicates.
(3 marks)
Hint
A virus can’t replicate by itself. Go through the stages: getting in, copying, making parts, leaving.
Mark Scheme
Max 3 marks
- Attachment proteins bind to receptors on the host cell (1 mark)
- The viral nucleic acid enters the cell (1 mark)
- The nucleic acid is replicated in the cell, or reverse transcriptase makes DNA from RNA (1 mark)
- The cell makes viral proteins (capsid and enzymes) (1 mark)
- New viruses are assembled and released (1 mark)
Also accepted / rejected
Also accepted
- “DNA”, “RNA” or “genetic material” for nucleic acid (points 2 and 3)
- “Bud off” or “burst out” for released (point 5)
Tips
- Link attachment proteins to receptors on the host cell
- The viral nucleic acid enters and is replicated; the cell makes viral proteins, then new viruses are assembled and released; don’t skip assembly
- Viruses don’t replicate by binary fission or mitosis, and “inject genetic information” is too vague
Describe the structure of the nucleus, and the functions it carries out in a eukaryotic cell.
(4 marks)
Hint
Think about what you’d see inside the nucleus, then what happens there: what is DNA used to make, and what processes copy or read it?
Mark Scheme
Max 4 marks: max 2 for structure, max 2 for function
Structure
- A nuclear envelope (double membrane) with pores (1 mark)
- Chromosomes (chromatin): DNA associated with histones (1 mark)
- A nucleolus (1 mark)
Function
- Holds the genetic information that codes for polypeptides (1 mark)
- DNA replication takes place here (1 mark)
- Transcription (making mRNA) takes place here (1 mark)
- The nucleolus makes rRNA (ribosomes) (1 mark)
Also accepted / rejected
Also accepted
- “Proteins” or “amino acid sequences” for polypeptides (point 4)
- Controlling which genes are expressed, as a function
Tips
- Give at least two functions as well as structures: you can only score 2 marks from structure alone
- For function, say the DNA codes for polypeptides, and name processes such as DNA replication, transcription or making ribosomes; “controls cell activities” is GCSE level
- The nucleolus makes ribosomes (rRNA); it doesn’t hold all the cell’s DNA
The Golgi apparatus is an organelle found in eukaryotic cells.
Describe two functions of the Golgi apparatus.
(2 marks)
Hint
Give two DIFFERENT functions. Processing and packaging are related: consider what else the Golgi does.
Mark Scheme
Max 2 marks
- Modifies and packages proteins, e.g. adds carbohydrate to make glycoproteins (1 mark)
- Modifies and packages lipids, e.g. makes glycolipids (1 mark)
- Forms vesicles or lysosomes (1 mark)
Also accepted / rejected
Also accepted
- “Processes” for modifies, or “transports” (points 1 and 2)
- Makes or packages polysaccharides (not cellulose), as an extra point
Not accepted
- Two answers that describe the same function, e.g. “processes lipids” and “makes glycolipids”
Tips
- Give two different functions: e.g. modifying/packaging proteins, and forming vesicles or lysosomes
- “Processing lipids” and “producing glycolipids” are the same function, so they only score once
- The Golgi apparatus doesn’t make ribosomes
Cells in the pancreas make digestive enzymes and release them into the small intestine.
Describe the role of organelles in the production and release of these enzymes.
Do not include details of transcription in your answer.
(5 marks)
Hint
Follow the pathway from gene to secreted enzyme. Which organelle is involved at each step? Don’t forget energy requirements.
Mark Scheme
Max 5 marks
- DNA in the nucleus codes for the enzyme (1 mark)
- Ribosomes on the rough endoplasmic reticulum make the enzyme (translation) (1 mark)
- The rough endoplasmic reticulum transports and modifies the enzyme (1 mark)
- Mitochondria make the ATP needed (1 mark)
- The Golgi apparatus modifies and packages the enzyme into vesicles (1 mark)
- Vesicles move to and fuse with the cell-surface membrane, releasing the enzyme (exocytosis) (1 mark)
Also accepted / rejected
Also accepted
- “Protein” or “polypeptide” instead of “enzyme” (all points)
- “Gene” or “genetic code” for DNA (point 1)
- “Golgi body” (point 5)
Not accepted
- Mitochondria “producing energy” (point 4)
Tips
- Focus on organelles: nucleus (DNA codes for the enzyme), ribosomes/rough ER (translation), rough ER (transport), Golgi apparatus (modifies and packages), vesicles fuse with the cell-surface membrane
- Include mitochondria producing ATP (not “producing energy”)
- Say vesicles fuse with the cell-surface membrane, not just take the enzyme “where it is needed”
- Don’t describe translation or protein structure in detail, or phagocytosis and DNA replication
What earns marks
- Ribosomes, packaging in the Golgi apparatus and exocytosis are the most common marks
Scientists investigated cells taken from the stomach wall of mice.
The stomach wall contains several different types of specialised cells.
Name the level of organisation made of specialised cells that are:
- all of one type
- of more than one type.
(1 mark)
Hint
Think about the levels of organisation in a multicellular organism. What is a group of one type of specialised cell called, and what is a structure made of several types called?
Mark Scheme
A tissue (all one type) and an organ (more than one type) (1 mark, both needed, in this order)
Tips
- Cells of one type form a tissue; cells of more than one type form an organ. Give them in this order
- Don’t use terms such as unicellular, multicellular, organ system, genus or phylum
A doctor does not prescribe antibiotics to a patient with flu.
Give one reason why antibiotics don’t work against viruses.
(1 mark)
Hint
Antibiotics target specific bacterial structures. What structures do bacteria have that viruses lack?
Mark Scheme
Viruses don’t have the structures or enzymes that antibiotics target, e.g. no cell wall (murein), or no metabolism of their own (1 mark)
Also accepted / rejected
Also accepted
- “No ribosomes” of their own
- A named process, e.g. they don’t make their own proteins
Not accepted
- “Viruses hide inside cells”
Tips
- Name what antibiotics target that viruses lack, e.g. a cell wall (murein) or bacterial enzymes
- “Viruses hide inside cells” is a GCSE-level answer that gains no mark
- Don’t confuse antibiotics with antibodies
An image from an optical microscope shows a single bacterial cell. In the image, the cell is 54 mm long.
The actual length of this bacterial cell is 1.8 µm.
Calculate the magnification of this image.
Show your working.
Magnification × ________
(2 marks)
Hint
Use the magnification formula. Be very careful with unit conversions between mm and µm.
Mark Scheme
× 30 000 (2 marks)
Working:
- Convert to the same units: 54 mm = 54 000 µm
- Magnification = image size ÷ actual size
- 54 000 ÷ 1.8 = 30 000
If the answer is wrong, 1 mark for any of:
- 54 000 µm (the image size in µm)
- ÷ 1.8 (dividing the image size by the actual size)
Also accepted / rejected
Also accepted
- Answers that round to 30 000
- Dividing 54 mm by 0.0018 mm
Tips
- Magnification = image size ÷ real size
- Convert units correctly: 54 mm = 54 000 µm, not 5400 µm
- Don’t divide the real size by the image size
Table 1 gives the resolution of three types of microscope.
Table 1
| Type of microscope | Resolution / µm |
|---|---|
| Optical (light) microscope | 0.2 |
| Scanning electron microscope (SEM) | 0.01 |
| Transmission electron microscope (TEM) | 0.0002 |
Table 2 gives the sizes of algal cells and mitochondria.
Table 2
| Structure | Diameter / µm |
|---|---|
| Algal cell | 8 to 12 |
| Mitochondrion | 0.5 to 1.0 |
For each investigation below, choose the most suitable microscope and give two reasons for your choice.
Use Table 1, Table 2 and your knowledge of microscopes.
Investigation 1 – looking at the living algal cells in a sample of pond water. A blue dye is added that only enters the dead cells.
Investigation 2 – seeing the three-dimensional surface shape of mitochondria.
(4 marks)
Hint
Compare each microscope’s resolution with the size of what you need to see. Which microscope can view living cells and colour, and which one shows the 3-D surface of a structure?
Mark Scheme
Max 4 marks
Investigation 1: optical (light) microscope (no mark for the name; max 2 from points 1 to 3)
- It can be used to view living cells (1 mark)
- It shows colour, so the blue dead cells can be told apart (1 mark)
- Its resolution (0.2 µm) is enough to see the algal cells (1 mark)
Investigation 2: scanning electron microscope (SEM) (no mark for the name)
- Its resolution (0.01 µm) is high enough to see mitochondria (1 mark)
- It shows surfaces in three dimensions (1 mark)
Also accepted / rejected
Also accepted
- The opposite, e.g. “electron microscopes can’t show colour” (point 2)
- If points 4 and 5 aren’t given, 1 mark for choosing a TEM to see internal structures, or because it has the highest resolution
Not accepted
- Points 1 to 3 given for any microscope other than an optical microscope
Tips
- Don’t mix up SEM and TEM. An SEM gives 3-D images of surfaces; a TEM gives 2-D images of internal structures
- Use resolution correctly. A smaller value means a higher resolution, so an SEM (0.01 µm) has a higher resolution than an optical microscope (0.2 µm)
- Points about ease of use or specimen preparation gain no marks; give reasons linked to living cells, colour, resolution and 3-D structure
What earns marks
- Choosing an optical microscope for investigation 1, because it can view living cells and show the colour of the stain
A scientist wants a pure sample of nuclei from liver tissue.
Describe and explain how the scientist could use cell fractionation and ultracentrifugation to obtain this sample.
(6 marks)
Hint
Think about why each property of the solution matters (cold, isotonic, buffered). For centrifugation, which organelles settle first and why?
Mark Scheme
Max 6 marks
- Homogenise the tissue to break open the cells and release the organelles (1 mark)
- Filter to remove whole cells and debris (1 mark)
- Use a cold solution to reduce enzyme activity (1 mark)
- Use an isotonic solution (same water potential) so the organelles don’t burst or shrink by osmosis (1 mark)
- Use a buffered solution so proteins don’t denature (1 mark)
- Centrifuge at a low speed, so the nuclei form the pellet (1 mark)
Also accepted / rejected
Also accepted
- “Blend”, “grind” or “chop” for homogenise (point 1)
- Up to 1000 × gravity as a low speed (point 6)
Not accepted
- Saying the solution stops cells bursting (point 4: it’s the organelles)
Tips
- Homogenise to break open the cells, then filter; don’t describe this as “fractionation”, and animal cells have no cell walls
- Explain each feature of the solution: cold to reduce enzyme activity; isotonic to stop organelles (not cells) bursting or shrinking; buffered to stop enzymes/proteins denaturing
- Nuclei are the densest organelles, so centrifuge at a low speed and they form the pellet
- Don’t describe increasing speeds or very high speeds to get the nuclei
What earns marks
- Homogenising and filtering are well known
Scientists investigated enzymes found in the cytoplasm of yeast cells.
The scientists broke open the cells to produce a suspension of cell contents.
Describe how the scientists would remove large organelles from this suspension of cell contents.
(2 marks)
Hint
Which piece of equipment separates organelles by density? Where would the heaviest organelles end up?
Mark Scheme
- Centrifuge the suspension at a low speed (or at increasing speeds) (1 mark)
- The large, dense organelles form the first pellet, which is removed (for example, the nuclei) (1 mark)
Also accepted / rejected
Also accepted
- Small organelles stay in the supernatant (point 2)
- Another named large organelle in the pellet, e.g. mitochondria (point 2)
Tips
- Centrifuge at a low (or gradually increasing) speed; only describing the high speeds of ultracentrifugation misses the mark
- The large, dense organelles form the pellet at the bottom of the tube; smaller ones stay in the supernatant
- Filtering only removes debris, so it isn’t enough on its own
Scientists investigated chloroplasts from spinach leaves. They broke open leaf cells and filtered the mixture to give a suspension of chloroplasts.
They divided the suspension between two tubes. A detergent that dissolves lipids was added to tube P only. Both tubes were then centrifuged at low speed.
Figure 1 shows the tubes after centrifuging.
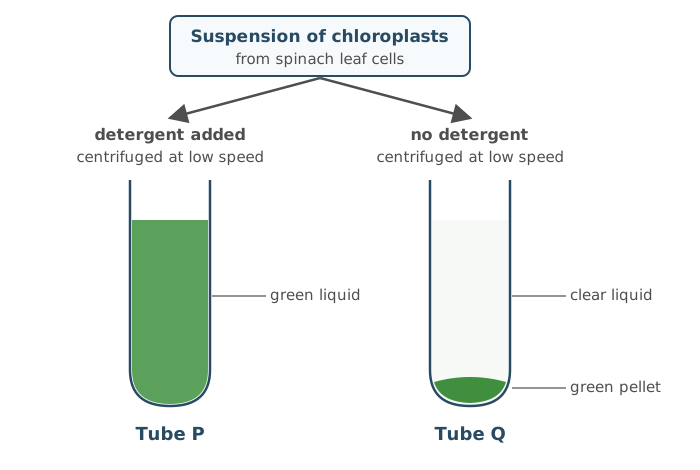
Explain the appearance of tubes P and Q.
(3 marks)
Hint
Where is chlorophyll found in a chloroplast? Where do large, dense organelles end up when centrifuged? What would the detergent do to the chloroplast membranes?
Mark Scheme
Tube Q
- The chlorophyll is inside the chloroplasts (in the thylakoid membranes) (1 mark)
- Chloroplasts are large and dense, so they form the pellet (1 mark)
Tube P
- The detergent dissolves the chloroplast membranes (phospholipids), so the chlorophyll is released into the liquid (1 mark)
Also accepted / rejected
Not accepted
- “The detergent dissolves lipids” without linking it to the membranes (point 3)
Tips
- Tube Q: the chlorophyll is inside intact chloroplasts, which are large and dense, so they form the green pellet
- Tube P: the detergent dissolved the membranes (phospholipids) of the chloroplasts and thylakoids, so the chlorophyll is released and stays in the liquid; “dissolves lipids” just repeats the stem
- Link each tube to what you can see: where the green colour ends up
Zika is a disease caused by the Zika virus.
Scientists designed a test to detect antibodies against the Zika virus in a patient’s blood sample. Figure 1 shows how the test works, and the negative and positive results.
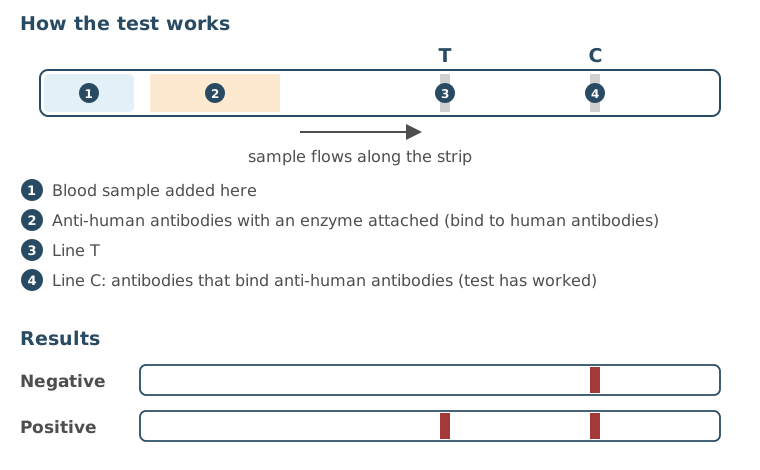
Suggest what is on the test at line T, and explain what causes the line to appear in a positive test.
(2 marks)
Hint
Read the question carefully: what is being detected, antibodies or antigens? Describe how the ELISA technique produces a visible result.
Mark Scheme
- Line T has Zika antigen (with the enzyme’s substrate) (1 mark)
- In a positive test, the enzyme on the anti-human antibody reacts with the substrate, forming enzyme-substrate complexes that give the colour (1 mark)
Also accepted / rejected
Also accepted
- “A colourless dye” for substrate (point 2)
Not accepted
- Antigen in the patient’s blood (point 1: the test detects antibodies)
Tips
- The test detects Zika antibodies in the blood, so line T holds Zika antigen (and substrate); it doesn’t detect the virus or antigen in the blood
- The line appears because the enzyme on the anti-human antibody reacts with the substrate, giving a colour change; say “enzyme”, not just a dye or beads
Prokaryotic and eukaryotic cells differ in their structure.
Give two features found in all prokaryotic cells but not in eukaryotic cells.
(1 mark)
Hint
The question says all prokaryotes. Which structures are only in some? Which features are also found in eukaryotic cells?
Mark Scheme
Any two of these (1 mark):
- No membrane-bound organelles
- Circular DNA
- DNA not associated with histones
- DNA free in the cytoplasm
- A cell wall containing murein (peptidoglycan)
Also accepted / rejected
Also accepted
- Only small (70S) ribosomes
- No introns
Not accepted
- Plasmids, a capsule or flagella (only some prokaryotes have them)
Tips
- Give features found in all prokaryotes, e.g. no membrane-bound organelles, circular DNA not associated with histones, murein cell wall
- Plasmids, capsules and flagella are only in some prokaryotes
- “70S ribosomes” alone doesn’t work, as eukaryotic cells have them too (in mitochondria and chloroplasts)
Some structures are found in some prokaryotic cells but not in all of them.
Name three of these structures.
(2 marks)
Hint
Every prokaryotic cell has a cell-surface membrane, cell wall, 70S ribosomes and circular DNA. Which other structures are found in only some of them?
Mark Scheme
Capsule, plasmids and flagella (2 marks)
All three correct = 2 marks; two correct = 1 mark
Also accepted / rejected
Also accepted
- Pili, or photosynthetic membranes (lamellae)
Tips
- Don’t give viral structures. A capsid belongs to a virus; the prokaryotic structure is a capsule
- Don’t give 70S ribosomes, as they are found in all prokaryotic cells
- Don’t give organelles that are only found in eukaryotic cells, such as mitochondria or a nucleus
- Spell key terms correctly, e.g. pili
What earns marks
- Capsule, plasmids and flagella are the most common correct answers
Virus particles share some structural features.
Name three of these features, and describe the function of one of them.
(2 marks)
Hint
Which features do virus particles share? What contains the genetic material, what surrounds it, and what helps the virus attach to host cells?
Mark Scheme
- Genetic material (DNA or RNA), a capsid and attachment proteins (1 mark)
- One correct function (1 mark), e.g.
- the genetic material codes for viral proteins
- the capsid protects the genetic material
- attachment proteins bind to receptors on the host cell
Also accepted / rejected
Also accepted
- “Nucleic acid” or “genome” for genetic material (point 1)
- “Glycoprotein” for attachment protein
- A correct function of a wrong feature still earns point 2, e.g. reverse transcriptase makes DNA from RNA
Not accepted
- “DNA and RNA” (point 1: a virus has one or the other)
Tips
- Give the three shared features: genetic material (DNA or RNA), capsid and attachment proteins
- Some viruses have DNA and others RNA, so write “DNA or RNA”, not that all viruses have one of them
- Don’t give features only some viruses have (reverse transcriptase, lipid envelope) or bacterial structures (capsule, plasmid, flagella)
- For attachment proteins, say they bind to receptors on the host cell
Viruses are described as acellular and non-living.
Explain why.
(2 marks)
Hint
Acellular means ‘not made of cells’. What would a cell have that a virus lacks? Think about organelles and cytoplasm.
Mark Scheme
- Acellular: they are not made of cells; they have no cell-surface membrane (1 mark)
- Non-living: they have no metabolism; they can’t replicate on their own (only inside a host cell) (1 mark)
Also accepted / rejected
Also accepted
- No cytoplasm or no organelles (point 1)
- They can’t respire, move or excrete on their own (point 2)
Not accepted
- “No membrane-bound organelles” (point 1: prokaryotic cells don’t have these either)
Tips
- Acellular means not made of cells: no cell-surface membrane, cytoplasm or organelles
- Don’t define acellular using non-living features (e.g. “can’t reproduce on their own”), or as “smaller than a cell” or “unicellular”
- Non-living: they have no metabolism and can’t replicate or respire independently
- “No mitochondria” isn’t a reason: prokaryotic cells lack mitochondria but are alive
What earns marks
- Explaining non-living as being unable to replicate without a host cell
Some molecules cross cell-surface membranes by facilitated diffusion. Others cross by active transport.
Describe each of these processes.
(3 marks)
Hint
Consider: What types of molecules need help crossing? What direction relative to the gradient? What provides the energy (if any)? What type of protein is involved in each?
Mark Scheme
- Both move polar or charged molecules or ions that can’t pass through the phospholipid bilayer (1 mark)
- Facilitated diffusion: movement down a concentration gradient through a carrier or channel protein (1 mark)
- Active transport: movement against a concentration gradient through a carrier protein, using ATP (1 mark)
Also accepted / rejected
Also accepted
- A named polar molecule or ion, e.g. glucose or Na⁺ (point 1)
Not accepted
- ATP being used in facilitated diffusion (point 2)
- A channel protein in active transport (point 3)
Tips
- Say facilitated diffusion uses channel or carrier proteins; “transport proteins” or “proteins” is too vague
- Say active transport uses carrier proteins (not channel proteins) and ATP
- Facilitated diffusion is passive: it does not use ATP
- Describe movement down or against a concentration gradient, not “along” or “with” it
- Mention that these processes move polar or charged molecules (e.g. ions)
A scientist set up the apparatus in Figure 1 to investigate osmosis.
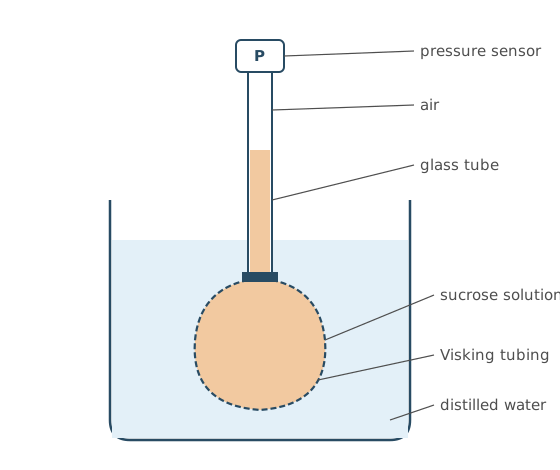
After an hour, the air pressure in the tube had increased.
Use your knowledge of osmosis to explain why.
(3 marks)
Hint
Compare the water potential of the two solutions. What type of membrane separates them? Where will water move, and what effect will this have on the volume inside?
Mark Scheme
- The sucrose solution has a lower water potential than the water in the beaker (1 mark)
- So water moves into the bag by osmosis, across the partially permeable Visking tubing (1 mark)
- The volume of solution increases, squashing the air into a smaller volume (1 mark)
Also accepted / rejected
Also accepted
- “More negative water potential” (point 1)
- “Selectively permeable” or “semi-permeable” (point 2)
Tips
- Use water potential, not “water concentration”: the sucrose solution has a lower water potential than the water
- Name the Visking tubing as the partially permeable membrane and give the direction water moves (into the sucrose solution)
- Say what changes: the volume of the sucrose solution increases, so the volume of air decreases
- Apply osmosis to this apparatus rather than just giving a definition
Cordgrass grows in salt marshes. At high tide, its roots are covered by sea water.
Scientists think that cordgrass roots absorb water from the sea water around them.
Describe an experiment that you could do to investigate whether cordgrass root cells have a lower water potential than sea water.
You are given:
- fresh cordgrass roots
- sea water
- laboratory equipment
(4 marks)
Hint
How could you tell if water moves into or out of root tissue? What would you measure before and after, and how would you make it fair?
Mark Scheme
Max 4 marks, from one method only
Method 1: change in mass
- Measure the mass of the root pieces before and after (1 mark)
- Leave them in sea water for a set time (1 mark)
- Blot dry before weighing again (1 mark)
- An increase in mass means water entered by osmosis, so the root cells have a lower water potential (1 mark)
Method 2: looking at cells for plasmolysis
Plasmolysis is when water leaves a plant cell and the cell membrane pulls away from the cell wall.
- Put thin pieces of root tissue on a slide (1 mark)
- Add sea water (1 mark)
- Look at the cells with an optical microscope (1 mark)
- If the cells stay turgid (don’t plasmolyse), the root cells have a lower water potential; if they plasmolyse, they don’t (1 mark)
Also accepted / rejected
Also accepted
- Length or diameter instead of mass (point 1)
- A dilution series of sea water (point 2)
- Working out the percentage of plasmolysed cells (point 8)
Tips
- Measure the mass (or length) of root pieces, leave them in sea water for a set time, blot dry, then measure again; the drying step is often missed
- An increase in mass means water entered by osmosis, so the root cells have a lower water potential
- It’s water that moves by osmosis, not “sea water”
- A potometer measures transpiration, not osmosis in cells
Bread contains a lot of starch.
Describe how starch is completely digested in a mammal.
(4 marks)
Hint
Digestion happens in two stages. Which enzyme acts first and what does it make? Which enzyme completes the digestion, and where is it?
Mark Scheme
Max 4 marks
- Hydrolysis (1 mark)
- Of glycosidic bonds (1 mark)
- Amylase breaks starch down to maltose (1 mark)
- Maltase breaks maltose down to glucose (1 mark)
- Maltase is membrane-bound (on the epithelial cells of the ileum) (1 mark)
Also accepted / rejected
Also accepted
- “Disaccharidase” for maltase (point 4)
- “On the microvilli” for membrane-bound (point 5)
Tips
- Describe two stages: amylase hydrolyses starch to maltose (name it, not just “disaccharide”), then membrane-bound maltase hydrolyses maltose to glucose
- Say hydrolysis of glycosidic bonds, not “breakdown” into “sugar”
- Bile salts and co-transport aren’t part of starch digestion
Vitamin D is a fat-soluble substance. Micelles are involved in its absorption.
Describe how vitamin D is absorbed into the cells lining the ileum.
(3 marks)
Hint
The vitamin is absorbed whole; it isn’t digested. How do micelles help it reach the cells, and how does it get in?
Mark Scheme
Max 3 marks
- Vitamin D combines with bile salts (forming micelles) (1 mark)
- This makes it more soluble in water (1 mark)
- Micelles carry vitamin D to the cells lining the ileum, keeping its concentration high next to the membrane (1 mark)
- Vitamin D diffuses into the cells (1 mark)
Also accepted / rejected
Not accepted
- Describing vitamin D being digested into fatty acids or monoglycerides (max 2 marks)
- Saying the micelles themselves are absorbed
Tips
- Describe how the whole vitamin is absorbed; describing lipid digestion limits you to 2 marks
- Micelles form when vitamin D combines with bile salts; this is not emulsification
- The micelle carries vitamin D to the cells; the vitamin D, not the micelle, diffuses across the membrane
- Vitamin D enters by simple diffusion, not by co-transport
Rotavirus infects the epithelial cells lining the ileum of young children. The infected cells lose their microvilli. As a result, the children absorb fewer products of digestion and less water, and they develop diarrhoea.
Explain why losing microvilli reduces the absorption of the products of digestion, and why this then reduces the absorption of water.
(3 marks)
Hint
What do microvilli provide for absorption? If more products of digestion stay in the ileum, what happens to the water potential there?
Mark Scheme
Products of digestion
- A smaller surface area, or fewer carrier (co-transport) proteins (1 mark)
Water
Normally, water follows the absorbed products of digestion into the cells by osmosis.
- More products of digestion stay in the lumen, so the water potential in the lumen stays lower than normal (1 mark)
- So there is a smaller water potential gradient, and less water moves from the lumen into the cells by osmosis (1 mark)
Also accepted / rejected
Also accepted
- Fewer channel proteins (point 1)
- The water potential in the cells is higher, or the water potential gradient is smaller (point 2)
- Water moves out of the cells into the ileum by osmosis (point 3)
Not accepted
- “SA” or “WP” written as abbreviations
Tips
- Losing microvilli means a smaller surface area and fewer carrier proteins, so fewer products of digestion are absorbed
- Water moves by osmosis, not diffusion; the unabsorbed products lower the water potential in the ileum
- Give the direction: less water moves out of the ileum into the cells
A grasshopper has a tracheal system. Air enters through spiracles and moves along tubes to the respiring tissues.
Name one adaptation of the gas exchange surface in this system, and explain its importance.
(2 marks)
Hint
Where does gas exchange actually happen in an insect: the spiracles, the tracheae or the tracheoles? Pick one feature of that surface and link it to diffusion.
Mark Scheme
Max 2 marks: one adaptation and why it matters
Either
- The tracheole walls are thin (one cell thick) (1 mark)
- So there is a short diffusion pathway and rapid diffusion into the cells (1 mark)
Or
- Tracheoles reach right into the tissues, next to the muscle fibres (1 mark)
- So gases diffuse directly into the cells, over a short diffusion pathway (1 mark)
Or
- The tracheoles are highly branched (1 mark)
- So there is a large surface area for rapid diffusion, or a short diffusion pathway (1 mark)
Also accepted / rejected
Also accepted
- “Touch” or “are close to” the cells for “reach into” (point 3)
- “Very many tracheoles” for highly branched (point 5)
Not accepted
- Features of the spiracles or tracheae; the tracheoles are the gas exchange surface
Tips
- The gas exchange surface is the tracheoles, so describe a feature of the tracheoles, not the spiracles
- Link the feature to diffusion, not just “gas exchange”, e.g. highly branched tracheoles give a large surface area for rapid diffusion
- Fluid moving out of the tracheoles, and saving water, aren’t features of the gas exchange surface
Leaves take in carbon dioxide for photosynthesis and release oxygen.
Describe and explain how the structure of a leaf is adapted for efficient gas exchange.
Do not refer to organelles in your answer.
(4 marks)
Hint
Follow the route gases take between the air and the cells inside a leaf, and link each adaptation to faster diffusion.
Mark Scheme
Max 4 marks
- Many stomata (1 mark)
- Stomata allow gases to diffuse in and out (1 mark)
- Air spaces in the mesophyll (1 mark)
- Mesophyll cells have a large surface area for diffusion (1 mark)
- Leaves have a large surface area to volume ratio, so diffusion is faster (1 mark)
- Leaves are thin, giving a short diffusion pathway (1 mark)
Tips
- Say there are many stomata, and that they allow gases to diffuse in and out
- Link every adaptation to diffusion; “for gas exchange” on its own isn’t enough
- Describe the large surface area of the mesophyll cells (their membranes), not just the large surface area of the whole leaf
- The short diffusion pathway comes from the leaf being thin, not from thin membranes or the leaf being flat
- Stick to the question. Xerophytic adaptations, the waxy cuticle, guard cells opening and closing, or light absorption gain no marks
- Use the right term, stomata, not “stroma” or “spiracles”
Ventilation keeps a steep oxygen concentration gradient between the air in the alveoli and the blood.
Describe how we breathe in.
(3 marks)
Hint
Which muscles contract, and what does each one move? How do these movements change the volume and pressure inside the chest?
Mark Scheme
- The diaphragm contracts and flattens (moves down) (1 mark)
- The external intercostal muscles contract, pulling the ribs up and out (1 mark)
- The volume of the thoracic cavity increases, so the pressure decreases (1 mark)
Also accepted / rejected
Also accepted
- “Thorax” or “lungs” instead of “thoracic cavity” (point 3)
Tips
- The diaphragm contracts and flattens; the external intercostal muscles contract and pull the ribs up and out
- The intercostal muscles move the ribs, not the diaphragm
- Then say what this does: the volume of the thoracic cavity increases and the pressure decreases
- Say “thoracic cavity”, not “chest”
- The route air takes through the airways gains no marks
Some chemicals, such as nitrites, change the iron in some haemoglobin molecules so that they can no longer bind oxygen.
Figure 1 shows the dissociation curve for oxyhaemoglobin:
- with no nitrite exposure
- after nitrite exposure, when 40% of the haemoglobin can no longer bind oxygen.
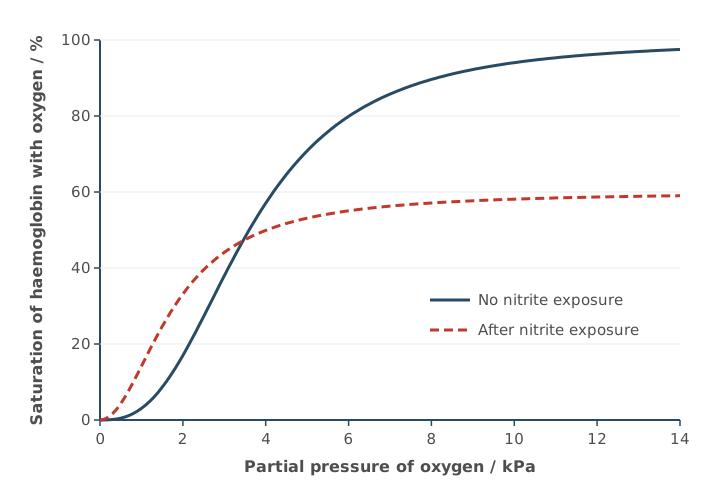
Using Figure 1, what can you conclude about how exposure to nitrites affects the loading and unloading of oxygen by haemoglobin?
Explain your answer.
(3 marks)
Hint
Compare the two curves at high pO₂ (in the lungs) and at low pO₂ (in respiring tissues). How much oxygen is loaded, and how readily is it unloaded?
Mark Scheme
Loading
- Less oxygen is loaded at high pO₂: the maximum saturation is only 60% (1 mark)
Unloading
- At low pO₂, haemoglobin has a higher affinity for oxygen (1 mark)
- So less oxygen is unloaded to respiring tissues at low pO₂ (1 mark)
Also accepted / rejected
Also accepted
- “In the lungs” for high pO₂ (point 1)
- “The curve levels off at 60%” (point 1)
- “In respiring cells” for low pO₂ (point 3)
Not accepted
- “More oxygen is loaded at low pO₂” (point 3: the point is that less is unloaded)
Tips
- Use the figure: after nitrite exposure, haemoglobin loads less oxygen at high pO₂ (maximum 60% saturation)
- At low pO₂ it has a higher affinity for oxygen, so it unloads less oxygen to respiring tissues
- Don’t say it “loads more readily at low pO₂”; the point is it unloads less
- The Bohr effect and pH aren’t relevant
Blood leaving a kidney is low in oxygen. Before it can supply oxygen to the heart muscle, it must pass through the lungs.
Describe the route taken by blood from a kidney to the coronary arteries.
Name the major blood vessels (arteries and veins) and the heart valves the blood passes through.
(5 marks)
Hint
Start at the renal vein and follow the blood back to the heart, through the right side, to the lungs and back, through the left side, and out to the coronary arteries. Name every vessel and valve.
Mark Scheme
- Renal vein → vena cava → right atrium (1 mark)
- Through the atrioventricular valve into the right ventricle (1 mark)
- Through the semilunar valve into the pulmonary artery → lungs → pulmonary vein (1 mark)
- Left atrium → atrioventricular valve → left ventricle (1 mark)
- Through the semilunar valve into the aorta → coronary arteries (1 mark)
Also accepted / rejected
Also accepted
- “Tricuspid” (right) and “bicuspid” or “mitral” (left) for the atrioventricular valves
- “Pulmonary valve” and “aortic valve” for the semilunar valves
Not accepted
- “AV valve” written instead of atrioventricular valve (penalised once)
Tips
- Don’t stop at the lungs. Continue through the left side of the heart and out to the coronary arteries
- Don’t mix up the pulmonary artery (heart to lungs) and the pulmonary vein (lungs to heart)
- Name the valves correctly, with an atrioventricular (tricuspid) valve on the right, an atrioventricular (bicuspid) valve on the left, and a semilunar valve leaving each ventricle
- Write “atrioventricular valve” in full, not “AV valve”
The aorta carries blood at high pressure away from the left ventricle.
Describe two features of the aorta wall, and explain how each is related to the function of the aorta.
(2 marks)
Hint
Name a tissue in the wall, then explain what it does as blood surges through with each heartbeat.
Mark Scheme
Max 2 marks
- Smooth muscle that can withstand the high pressure (1 mark)
- Elastic tissue that stretches and recoils, smoothing out the blood pressure (1 mark)
- A smooth endothelium that reduces friction (1 mark)
- Collagen (protein) that stops the wall splitting under high pressure (1 mark)
Also accepted / rejected
Also accepted
- “Expands” for stretches (point 2)
Not accepted
- “Contracts and relaxes” for recoils (point 2)
- “Thick wall” on its own, without naming the muscle
Tips
- Name a structure and link it to a function: smooth muscle withstands high pressure; elastic tissue stretches and recoils to smooth or maintain blood pressure
- Give both stretch and recoil
- Muscle in the aorta wall doesn’t pump blood
- The smooth endothelium (not epithelium) reduces friction
After a severe burn, the capillaries near the burn become leaky. Plasma proteins move out of the capillaries into the tissue fluid.
Explain how this affects the return of tissue fluid to the capillaries.
(2 marks)
Hint
How do proteins in the tissue fluid change its water potential? Which way will water then move by osmosis?
Mark Scheme
- The proteins lower the water potential of the tissue fluid (1 mark)
- So less water returns to the capillaries by osmosis (1 mark)
Also accepted / rejected
Also accepted
- The water potential of the blood is higher than before, or the water potential gradient is smaller (point 1)
- “No water returns” (point 2)
Not accepted
- “WP” for water potential (point 1)
Tips
- Proteins in the tissue fluid lower its water potential, so say which way it changes and where
- It’s water that moves back by osmosis, not “tissue fluid”
- Give the direction: less water returns to the capillaries
Plants make carbohydrate in their leaves by photosynthesis.
Describe how carbohydrate is transported in a plant.
(5 marks)
Hint
Which carbohydrate is moved, and in which tissue? How does it get in, why does water follow, and what makes the contents flow?
Mark Scheme
Max 5 marks
- Sucrose is actively loaded into the phloem (co-transported with H⁺ ions) (1 mark)
- By companion cells (1 mark)
- This lowers the water potential in the phloem, so water enters by osmosis (from the xylem) (1 mark)
- This creates a high hydrostatic pressure (a pressure gradient) (1 mark)
- The contents move by mass flow to respiring cells or storage organs (1 mark)
- Sucrose is unloaded by active transport (1 mark)
Also accepted / rejected
Also accepted
- “Sieve tube” for phloem (point 1)
- Named sinks, e.g. roots, fruits or growing shoots (point 5)
- Facilitated diffusion for unloading (point 6)
Tips
- Name the carbohydrate: sucrose
- Companion cells load sucrose (co-transport with H⁺); this lowers the water potential, so water enters by osmosis and the hydrostatic pressure rises
- The contents move by mass flow down the pressure gradient, not by diffusion
- Say where it goes (respiring cells or storage organs) and how it leaves the phloem
In a tall tree, water moves up the xylem from the roots to the leaves. Xylem vessels have no end walls, so they form a continuous tube.
Explain why it is important for water transport that the xylem forms a continuous tube.
(3 marks)
Hint
Think of cohesion-tension. What has to be unbroken for water to be pulled up? What holds the water molecules together, and what creates the pull?
Mark Scheme
- There is an unbroken column of water, with no barrier to water movement (1 mark)
- Cohesion: hydrogen bonds between water molecules hold the column together (1 mark)
- Evaporation (transpiration) from the leaves creates tension that pulls the column up (1 mark)
Also accepted / rejected
Also accepted
- “A continuous stream of water” (point 1)
- Water moving out of the xylem into leaf cells creates tension (point 3)
- If none of points 1 to 3 is given, 1 mark for “cohesion-tension moves water up the xylem”
Not accepted
- “A chain of water molecules” on its own (point 1)
Tips
- Give all three parts of cohesion-tension: an unbroken water column, cohesion from hydrogen bonds between water molecules, and tension created by transpiration
- Explain how the tension is created (by evaporation from the leaves); this part is often missed
- Don’t bring in translocation, sources and sinks, or sugars; the xylem carries water
Cotton plants are grown in hot, dry regions.
Scientists investigated the rate of transpiration of a cotton plant over 24 hours.
Figure 1 shows the scientists’ results.
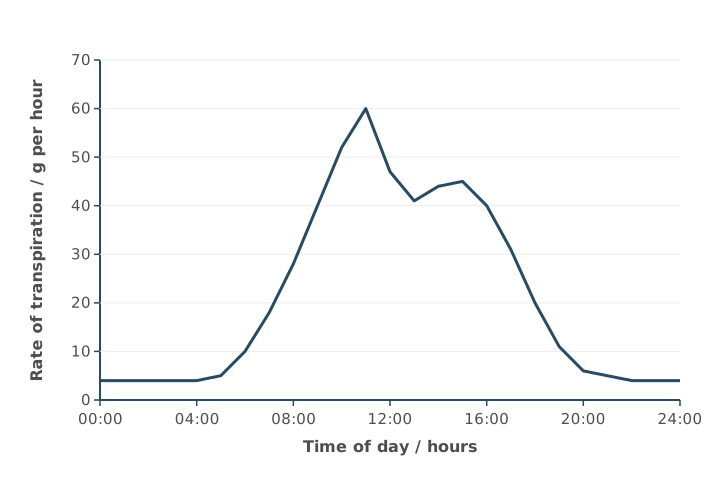
Explain the change in the rate of transpiration between 07:00 and midday shown in Figure 1.
(4 marks)
Hint
What happens to temperature and light between 07:00 and midday? How does each affect evaporation from leaves, and what do the stomata do during the morning and at midday?
Mark Scheme
- Temperature or light intensity increases (or humidity decreases), so transpiration increases (1 mark)
- Because water molecules have more kinetic energy, or there is a steeper water potential gradient (1 mark)
- Stomata open (wider) in the morning to let carbon dioxide in for photosynthesis (1 mark)
- Some stomata close at midday (after 11:00), so the rate falls (1 mark)
Also accepted / rejected
Also accepted
- More wind (air movement) as the factor (point 1)
- “Allowing gas exchange” (point 3)
Tips
- Explain, don’t describe the graph: name a factor (e.g. rising temperature or light intensity, not “the sun”) and say why it increases transpiration (more kinetic energy, or a steeper water potential gradient)
- Stomata open, and open wider, during the morning to let carbon dioxide in for gas exchange; water loss is a consequence, not the reason they open
- Some stomata close around 11:00, so the rate falls
- Changes in the rate of photosynthesis don’t explain this part of the graph
Coeliac disease damages the villi in the small intestine.
Scientists used microscope images of villi from a healthy person and from a person with coeliac disease. They calculated the surface area to volume ratio of one villus from each person. Some of their results are shown in Table 1.
Table 1
| Villus | Surface area / µm² | Volume / µm³ | Surface area:volume ratio |
|---|---|---|---|
| Healthy | 9.6 × 10³ | 3.4 × 10⁴ | |
| Damaged | 4.3 × 10³ | 0.15:1 |
Complete Table 1. Give your calculated surface area:volume ratio and volume to 2 significant figures.
(2 marks)
Hint
Which way round is the ratio: surface area ÷ volume, or volume ÷ surface area? Rearrange for the missing volume. Check the significant figures.
Mark Scheme
1 mark for each correct value (2 marks)
- Healthy villus ratio: 0.28:1
- Damaged villus volume: 2.9 × 10⁴ µm³ (29 000)
Working:
- Healthy ratio: 9.6 × 10³ ÷ 3.4 × 10⁴ = 0.28
- Damaged volume: 4.3 × 10³ ÷ 0.15 = 28 667
- To 2 significant figures: 29 000
If neither is right, 1 mark for 0.2824 or 28 667 (right working, not to 2 significant figures).
Tips
- Surface area:volume ratio is surface area ÷ volume: 9.6 × 10³ ÷ 3.4 × 10⁴ = 0.28:1
- For the volume, rearrange: 4.3 × 10³ ÷ 0.15 = 28 667, which is 29 000 to 2 significant figures (not 28 000)
Scientists investigated the effect of grazing by sheep on the diversity of plant species in grassland.
Table 1 shows their raw data for one grazed area.
Table 1
| Plant species | Total shoot biomass / g m⁻² |
|---|---|
| Agrostis capillaris | 20 |
| Festuca rubra | 30 |
| Lotus corniculatus | 4 |
| Plantago lanceolata | 8 |
| Ranunculus acris | 6 |
| Trifolium repens | 12 |
The scientists used this equation to calculate the plant species index of diversity.
d = 1 − Σ(n/N)²
where n = shoot biomass of each plant species
and N = total shoot biomass of all plant species
Use this equation to calculate the index of diversity for the data in Table 1.
Index of diversity = ________
(2 marks)
Hint
Add up the biomass first to find N. Then work out (n/N)² for each species. What’s the last step of the equation?
Mark Scheme
0.76 (or 0.756) (2 marks)
Working:
- N = 20 + 30 + 4 + 8 + 6 + 12 = 80
- Σ(n/N)² = 0.0625 + 0.1406 + 0.0025 + 0.0100 + 0.0056 + 0.0225 = 0.244
- d = 1 − 0.244 = 0.756
If the answer is wrong, 1 mark for any of:
- 0.244 (not subtracted from 1)
- N = 80 (the total biomass)
Also accepted / rejected
Also accepted
- 0.8 (correct rounding)
Tips
- Use the equation given in the question, not the one you learnt from the specification
- Total the biomass first (N = 80), then add up (n/N)² for every species and subtract from 1: d = 0.76
- Don’t forget the final step of subtracting from 1 (0.24 only scores 1 mark)
Scientists investigated the effect of grazing by sheep on the diversity of plant species in grassland. They measured the shoot biomass of each plant species.
Suggest one reason the scientists used biomass instead of the number of individuals of each plant species when collecting data to measure diversity.
(1 mark)
Hint
Picture trying to count individual grass plants in a field. Why might that be hard?
Mark Scheme
Individual plants are too small or too numerous to count, or they can’t be separated into individuals (1 mark)
Also accepted / rejected
Also accepted
- Counting individuals would take too long
Tips
- Biomass is used here to measure the abundance of each species, because individual plants are too small or too numerous to count, or can’t be separated
- “Counting is difficult” alone isn’t enough: say why (too small or too many)
- It isn’t about energy flow, pyramids of biomass, or removing water
In the nucleus of a eukaryotic cell, DNA is found in chromosomes.
Describe the structure of a DNA molecule, and how DNA is arranged in a chromosome.
(6 marks)
Hint
Start with the monomer and how the monomers join. How are the two strands held together? Then: what is DNA wrapped around, and what does a chromosome look like before it divides?
Mark Scheme
Max 6 marks
DNA
- DNA is a polymer of nucleotides (1 mark)
- Each nucleotide has deoxyribose, a phosphate group and a nitrogenous base (1 mark)
- Nucleotides are joined by phosphodiester bonds (1 mark)
- Two strands form a double helix, held together by hydrogen bonds (1 mark)
- Adenine pairs with thymine, and cytosine pairs with guanine (1 mark)
Chromosome
- The DNA is associated with histones (proteins) (1 mark)
- When visible during cell division, a chromosome has two chromatids joined at a centromere (1 mark)
Also accepted / rejected
Also accepted
- “Polynucleotide” (point 1)
- A correctly labelled diagram
Not accepted
- Bases given as letters only (A, T, C, G) (point 5)
- “Adenosine” or “cysteine” for adenine or cytosine
Tips
- Start with DNA being a polymer of nucleotides; this is often left out
- Write the base names in full (adenine, thymine, cytosine, guanine); letters alone gain no marks
- Say where the phosphodiester bonds are: between nucleotides
- For the chromosome: DNA associated with histones, and two chromatids joined at a centromere
Scientists studying a bacterium sequenced its genome and then identified its proteome.
Define the terms genome and proteome.
(2 marks)
Hint
One term is about the DNA, the other about the proteins. Is it everything in one cell, or everything in a species?
Mark Scheme
- Genome: the complete set of genes (all the DNA) in a cell (1 mark)
- Proteome: the full range of proteins that a cell is able to produce (that its DNA codes for) (1 mark)
Also accepted / rejected
Also accepted
- “Organism” for cell (points 1 and 2)
- All the genetic material in a cell (point 1)
Not accepted
- All the DNA in a species or population (point 1)
- “The number of proteins” or “all the proteins in a cell” (point 2: it’s the range it can make)
Tips
- Genome: the complete set of genes (all the DNA) in a cell; “genetic information” or “the genetic code” is too vague
- Proteome: the full range of proteins a cell can produce; “all the proteins in a cell” isn’t enough
- Define both for a cell or organism, not a species or population
mRNA and tRNA are both types of RNA involved in protein synthesis.
Give three ways in which the structure of an mRNA molecule is different from the structure of a tRNA molecule.
| mRNA | tRNA | |
|---|---|---|
| 1 | ||
| 2 | ||
| 3 |
(3 marks)
Hint
Think about the overall shape, relative length, and special features each type has for its function. Make sure you compare like with like.
Mark Scheme
Any three rows, each comparing the same feature (3 marks)
| mRNA | tRNA | |
|---|---|---|
| 1. | Has codons | Has an anticodon |
| 2. | No hydrogen bonds (no base pairing) | Hydrogen bonds between some bases |
| 3. | No amino acid binding site | Has an amino acid binding site |
| 4. | Linear (straight) | Clover-leaf shape (folded) |
| 5. | Long (many nucleotides) | Short (few nucleotides) |
Also accepted / rejected
Not accepted
- A row that doesn’t compare the same feature, e.g. “mRNA has codons, tRNA is folded”
Tips
- Compare the same feature on each row, e.g. mRNA is linear/straight while tRNA is clover-leaf shaped
- mRNA and tRNA both contain uracil and are both single-stranded; neither is a double helix, and tRNA doesn’t contain exons
- Say tRNA has an amino acid binding site, not just “has an amino acid”
- mRNA is longer than tRNA, not shorter
- “mRNA has codons but tRNA doesn’t” isn’t a valid comparison: tRNA has an anticodon
Cells in the pancreas make large amounts of the protein insulin. After transcription, the insulin mRNA leaves the nucleus.
Describe how the insulin polypeptide is made from this mRNA. In your answer, include the roles of ribosomes, tRNA and ATP.
(6 marks)
Hint
Work through translation in order. Where does the ribosome attach, and how much of the mRNA does it cover? What does tRNA bring, and how does it pair with the mRNA? Where is ATP used (two places)?
Mark Scheme
Max 6 marks
- The ribosome attaches to the mRNA (1 mark)
- The ribosome covers two codons at a time, starting at the start codon (AUG) (1 mark)
- ATP provides energy to attach amino acids to tRNA (1 mark)
- tRNA brings a specific amino acid to the ribosome (1 mark)
- tRNA anticodons bind to complementary mRNA codons (1 mark)
- ATP provides energy to form peptide bonds (1 mark)
- The ribosome moves along the mRNA to the stop codon, forming the insulin polypeptide (1 mark)
Also accepted / rejected
Also accepted
- “Binds” or “joins” instead of “attaches” (point 1)
- “Rough endoplasmic reticulum” for the ribosome (point 1)
Tips
- Include both roles of ATP, attaching amino acids to tRNA, and forming peptide bonds. The first is often missed
- Say the ribosome covers two codons at a time
- For codon–anticodon pairing, use both key words. tRNA anticodons bind to complementary mRNA codons
- Describe the ribosome moving along the mRNA, forming a polypeptide, until it reaches a stop codon
What earns marks
- Answers set out in a logical sequence, including the ribosome attaching at the start codon
Table 1 shows some mRNA codons and the amino acid coded for by each codon.
Table 1
| mRNA codon | Amino acid |
|---|---|
| ACC | Thr |
| AUG | Met |
| CAU | His |
| CCU | Pro |
| GGA | Gly |
| GUA | Val |
| UAC | Tyr |
| UGG | Trp |
Figure 1 shows the mRNA base sequence produced when part of a gene coding for a protein is transcribed.
Figure 1
| CAU | GGA | UGG |
|---|
Use Table 1 to work out the sequence of amino acids coded for by the mRNA in Figure 1.
(1 mark)
Hint
Use the mRNA codons directly with the table; don’t convert them to anything else first. Read each three-base sequence carefully.
Mark Scheme
His, Gly, Trp (in this order) (1 mark)
Tips
- Use the mRNA codons in Figure 1 directly (CAU, GGA, UGG): His, Gly, Trp
- Don’t use the complementary sequence (that gives Val, Pro, Thr)
Myxomatosis is a disease of rabbits caused by the myxoma virus. The virus was released in Australia in 1950 and killed most of the wild rabbits. Today, most wild rabbits in Australia are resistant to myxomatosis.
Use your knowledge of natural selection to explain why resistance is now so common in these rabbits.
(4 marks)
Hint
Where did the resistance come from in the first place? Which rabbits survived the disease, and what did they pass on?
Mark Scheme
- A mutation produced a resistance allele (1 mark)
- Rabbits with this allele survived myxomatosis (were less likely to die from it) (1 mark)
- So they reproduced and passed on the allele (1 mark)
- Over many generations, the frequency of the allele increased (1 mark)
Also accepted / rejected
Also accepted
- The opposite for point 2, e.g. rabbits without the allele died of myxomatosis
- “The allele became more common” or “a higher proportion had the allele” (point 4)
Not accepted
- “Gene” for allele (penalised once)
- The virus causing the mutation (point 1)
- “The number of alleles increased” (point 4: it’s the frequency)
Tips
- Use the context: a mutation in the rabbits (not in the virus) produced a resistance allele, and rabbits with it survived myxomatosis
- Say “allele”, not “gene” or “trait”
- Finish the chain: they reproduce and pass on the allele, so over generations the allele frequency increases
- This is resistance, not immunity, so don’t describe an immune response
Strains of bacteria with antibiotic resistance are common on farms where large numbers of pigs are kept close together.
Use your knowledge of selection to explain why.
(3 marks)
Hint
Think about why antibiotic use on these farms acts as a selection pressure, which bacteria survive, and what happens to the frequency of the resistance allele over generations.
Mark Scheme
- Antibiotics are used often on these farms, so the bacteria are regularly exposed to them (a selection pressure) (1 mark)
- Bacteria with the resistance allele survive, reproduce and pass on the allele (1 mark)
- So the frequency of the resistance allele increases (1 mark)
Also accepted / rejected
Also accepted
- Instead of point 1, resistant bacteria spread easily between pigs that are kept close together
- “Divide” or “binary fission” instead of “reproduce”
Not accepted
- “Gene” instead of “allele”, or “immunity” instead of “resistance”
Tips
- Link it to the farms. Antibiotics are used a lot there, or resistant bacteria spread easily between pigs kept close together
- Say that bacteria with the resistance allele survive, reproduce and pass on the allele
- Finish with the result, that the frequency of the resistance allele increases
- Use “allele”, not “gene”, and “resistance”, not “immunity”
- This is about antibiotics, not vaccines
A student tested whether clove oil kills bacteria. She used a pipette to transfer 0.1 cm³ of a bacterial culture from a bottle onto an agar plate. She then spread the culture over the agar with a spreader.
Describe the aseptic techniques the student should use.
(3 marks)
Hint
Go through her steps one by one: her hands and bench, the pipette, the bottle, the agar plate and the spreader. How does she stop other microorganisms getting in at each step?
Mark Scheme
Max 3 marks
- Disinfect the bench (or wash hands) (1 mark)
- Use a sterile pipette (1 mark)
- Flame the neck of the bottle after removing the lid (1 mark)
- Lift the lid of the agar plate only slightly (at an angle) (1 mark)
- Work near a Bunsen flame, where air moves upwards (1 mark)
- Use a sterile spreader (1 mark)
- Put the used pipette and spreader into disinfectant straight away (1 mark)
Also accepted / rejected
Also accepted
- Antiseptic or alcohol wipes (point 1)
- A pipette from an unopened pack (point 2)
- Flaming the spreader, or dipping it in alcohol and then flaming it (point 6)
Not accepted
- An inoculating loop to transfer the culture (point 2)
- “The flame sterilises the air” (point 5: the rising air carries microbes away)
Tips
- Describe steps that fit this practical: disinfect the bench, sterile pipette, flame the neck of the bottle, lift the lid at an angle, sterile spreader
- Use a pipette, not a loop, to transfer a measured volume
- Don’t flame the lid or the agar; upward air currents carry microbes away, they don’t kill them
- Gloves, working quickly or closing windows gain no marks
A student investigated whether clove oil kills bacteria. She spread five different bacterial cultures on separate agar plates.
On each plate she placed three paper discs: one soaked in clove oil diluted with olive oil, one for a positive control and one for a negative control. She kept the plates at 25 °C for 48 hours, then measured the diameter of the clear zone with no bacterial growth around each disc.
Figure 1 shows one of her plates after 48 hours.
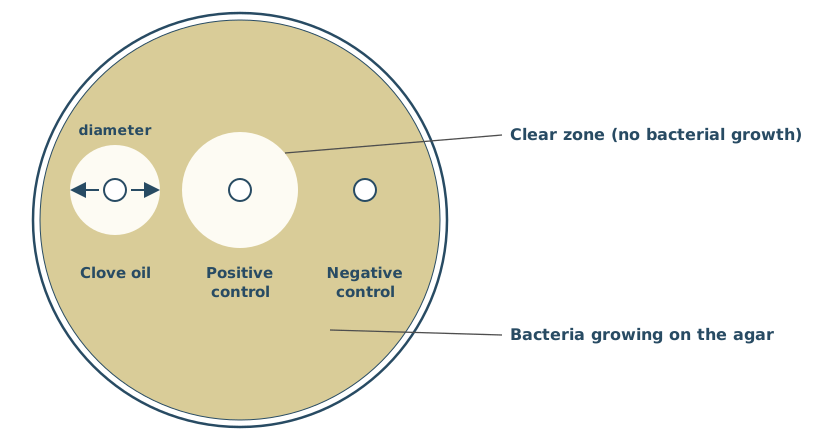
Suggest exactly what the student soaked the discs in to get the positive control and negative control results.
(2 marks)
Hint
A positive control should give a known positive result. A negative control should give a known negative result. What would you soak each disc in?
Mark Scheme
Positive control
- A known antibacterial substance, e.g. an antibiotic or a disinfectant (1 mark)
Negative control
- Olive oil without clove oil, or sterile water (1 mark)
Also accepted / rejected
Also accepted
- A named antibiotic, antiseptic or disinfectant (point 1)
- If the answer isn’t labelled, the first substance counts as the positive control
Tips
- Positive control: a known antimicrobial (e.g. an antibiotic or disinfectant)
- Negative control: sterile water or olive oil without clove oil; “do nothing to the disc” or “add bacteria” is wrong
- Don’t swap them, and antibodies aren’t a positive control
Figure 1 shows the chromosomes in a parent cell, and in the two cells produced by the first division of meiosis.
In the second division, non-disjunction happens in chromosome N. Everything else divides normally.
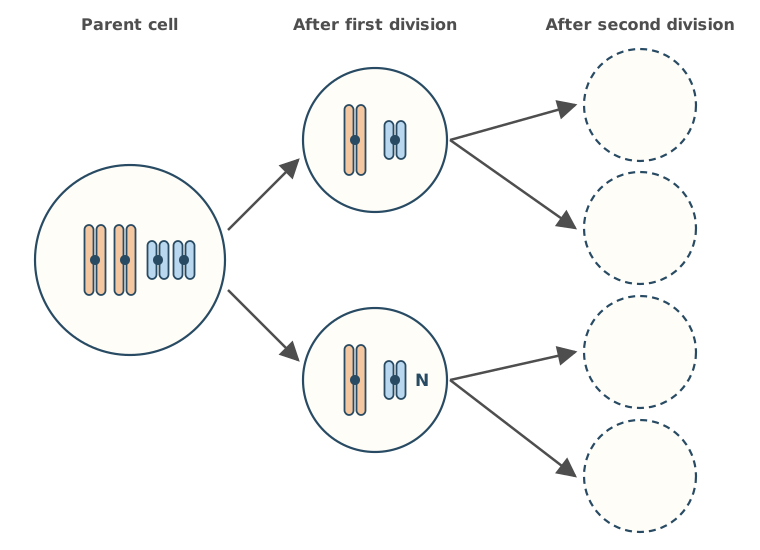
Complete Figure 1 to show the chromosomes in the four cells produced by the second division.
(2 marks)
Hint
In the second division, what separates? What happens to chromosome N if non-disjunction occurs?
Mark Scheme
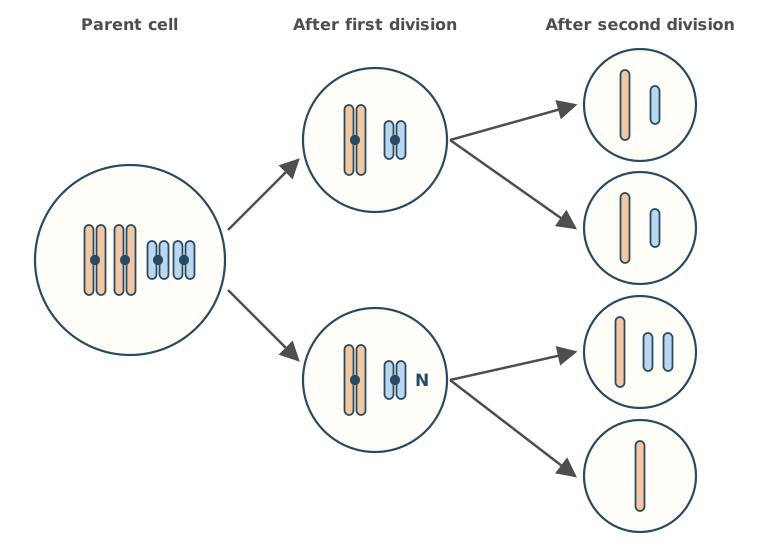
- Top two cells: each has one long and one short chromosome (single chromatids) (1 mark)
- Bottom two cells: one has one long and two short, the other has one long only (1 mark)
Also accepted / rejected
Also accepted
- The bottom two cells either way round
- Chromosomes drawn a slightly different length
Tips
- In the second division the sister chromatids separate, so draw single chromatids in the daughter cells
- For chromosome N, both chromatids go into one daughter cell and none into the other; only that chromosome is affected, so no cell ends up with no chromosomes
Body cells of a female fruit fly, Drosophila melanogaster, contain 8 chromosomes.
Figure 1 shows the appearance of these 8 chromosomes just as a cell enters meiosis.
Using the information in Figure 1, draw the chromosomes as they would appear in one cell at the end of the first meiotic division.
(1 mark)
Hint
The first meiotic division separates homologous pairs. How many of these eight chromosomes end up in each cell, and are they still made of two chromatids?
Mark Scheme
Four chromosomes, one from each pair, so each is a different size, and each still made of two chromatids, drawn in any order (1 mark)
For example,
Tips
- Draw 4 chromosomes, one from each homologous pair, so each one is a different size
- Each chromosome still has two chromatids at the end of the first meiotic division
- Don’t draw 8 single chromatids (the result of mitosis), 8 chromosomes with two chromatids (no halving) or 4 single chromatids (the result of the second division)
New alleles arise by mutation, which increases genetic variation within a species.
Describe and explain the other processes that increase genetic variation within a species.
(4 marks)
Hint
Think about what happens to homologous chromosomes during meiosis, and what happens when gametes meet.
Mark Scheme
- Independent segregation of homologous chromosomes (in meiosis) (1 mark)
- Crossing over between homologous chromosomes (1 mark)
- Random fertilisation of gametes (1 mark)
- These produce new combinations of alleles (1 mark)
Also accepted / rejected
Also accepted
- “Random” for independent, and “assortment” for segregation (point 1)
- “Random fusion of gametes” (point 3)
- New combinations of maternal and paternal chromosomes, as an extra point
- If no other marks: 1 mark for “meiosis produces genetically different cells”
Not accepted
- “Random mating” (point 3)
Tips
- Say crossing over happens between homologous chromosomes, and independent segregation is of homologous pairs
- Finish by saying these produce new combinations of alleles
- Say fertilisation of gametes is random, not just “fertilisation is random”
- Migration and natural selection change allele frequencies but don’t create new combinations; non-disjunction is a mutation, which the question excludes
A student investigated whether clove oil kills bacteria. She spread five different bacterial cultures on separate agar plates.
On each plate she placed a paper disc soaked in clove oil and a paper disc soaked in a positive control. She measured the diameter of the clear zone with no bacterial growth around each disc, to the nearest whole mm.
Table 1 shows her results.
Table 1
| Bacterial culture | Diameter of clear zone with clove oil / mm | Diameter of clear zone with positive control / mm |
|---|---|---|
| Escherichia coli | 14 | 18 |
| Staphylococcus aureus | 19 | 22 |
| Bacillus subtilis | 16 | 20 |
| Pseudomonas fluorescens | 11 | 15 |
| Micrococcus luteus | 15 | 20 |
| Mean for all cultures | 15 | 19 |
| Standard deviation for all cultures | 2.9 | 2.6 |
The mean ± 2 standard deviations includes over 95% of the data.
Use this information to consider whether the standard deviations suggest the difference in means is likely to be due to chance.
Explain your answer, including at least one calculation.
(2 marks)
Hint
Use mean ± 2 SD to find a range for each column. Do the two ranges overlap, and what does that suggest about the difference between the means?
Mark Scheme
- Mean ± 2 SD: clove oil 9.2 to 20.8 mm and positive control 13.8 to 24.2 mm (1 mark)
- The ranges overlap, so the difference in means is likely to be due to chance (not significant) (1 mark)
Also accepted / rejected
Also accepted
- Using mean ± 1.96 SD: 9.3 to 20.7 and 13.9 to 24.1 (point 1)
Not accepted
- “The results are due to chance” (point 2: it’s the difference in means)
- “The results are significant”
Tips
- The table gives one SD, so double it: 15 ± 5.8 = 9.2 to 20.8, and 19 ± 5.2 = 13.8 to 24.2
- The ranges overlap, so the difference in means is likely due to chance (not significant)
- Talk about the “difference”, not “the results”, being due to chance
Courtship behaviour in the three-spined stickleback, Gasterosteus aculeatus, involves male fish:
- performing a zigzag dance to attract sexually active females
- leading a female to his nest to start mating
- chasing females away when the male is not sexually active.
Scientists investigated stickleback courtship behaviour by feeding a population of sexually active male sticklebacks a diet containing bisphenol A (BPA), a chemical that acts like the hormone oestrogen. The scientists also fed a separate control population of sexually active males a diet without BPA.
They determined the percentage of males performing zigzag dances or chasing females away in each population.
Table 1
| Population | Percentage of males performing zigzag dances | Percentage of males chasing females away |
|---|---|---|
| Males fed BPA | 62 | 18 |
| Males not fed BPA (control) | 91 | 3 |
The scientists also investigated the effect on female courtship behaviour of feeding BPA to the males.
Table 2
| Population | Median time females spent in courtship / s |
|---|---|
| Males fed BPA | 41 |
| Males not fed BPA (control) | 95 |
BPA is used to make some plastics. Some BPA leaks into rivers from landfill sites and wastewater.
Suggest and explain the effect BPA pollution in rivers will have on stickleback breeding.
Use information from Table 1 and Table 2 in your answer.
(4 marks)
Hint
Use BOTH tables. For each behaviour that changes, think about its function: what does that change mean for breeding success?
Mark Scheme
Max 4 marks
Effect on breeding
- Less mating, so fewer offspring (1 mark)
Explanation (max 3 from points 2 to 5)
- Fewer zigzag dances, so fewer females are attracted (1 mark)
- Fewer males lead females to the nest, because fewer are sexually active (1 mark)
- More chasing females away, because more males are not sexually active (1 mark)
- Females spend less time in courtship (1 mark)
Also accepted / rejected
Also accepted
- “Mature” instead of “sexually active” (point 4)
Tips
- Give the effect first: less mating/breeding, so fewer offspring
- Link each piece of data to its meaning: fewer zigzag dances so fewer females attracted; more chasing females away so more males not sexually active
- Use Table 2 correctly: females spent less time in courtship, not “fewer females”
- Use both tables; don’t just quote figures or describe trends
What earns marks
- Less time spent in courtship leading to fewer offspring
The bacterium Helicobacter pylori lives in the human stomach and is usually passed from parents to their children. It evolved from a common ancestor in Africa. As humans migrated around the world, new strains of H. pylori evolved.
Figure 1 shows a phylogenetic diagram of the evolution of some of these strains.
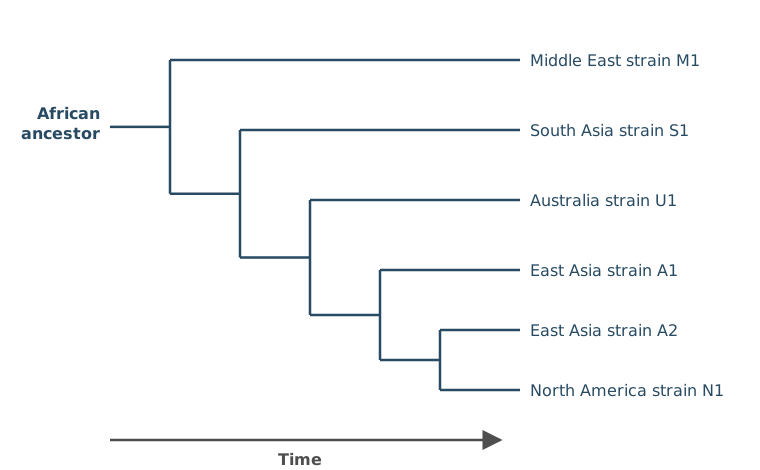
What does Figure 1 suggest is the order of human migration out of Africa?
Tick (✓) one box.
(1 mark)Hint
Follow the time arrow from left to right. Which region’s strain branches off from the African ancestor first, and which next?
Mark Scheme
B: Middle East, South Asia, Australia, East Asia, North America (1 mark)
Tips
- Read the phylogenetic diagram from left to right: the earliest branch from the African ancestor is the Middle East (M1), then South Asia (S1), then Australia (U1), then East Asia (A1), then North America (N1)
Ladybirds are beetles that feed on aphids. Four species of ladybird were found feeding on the black bean aphid, Aphis fabae, on a broad bean plant, Vicia faba:
- the seven-spot ladybird, Coccinella septempunctata
- the eleven-spot ladybird, Coccinella undecimpunctata
- the two-spot ladybird, Adalia bipunctata
- the harlequin ladybird, Harmonia axyridis.
How many different genera of ladybirds are there in the information provided?
(1 mark)
Hint
The genus is the first word of each scientific name. How many different first words are there among the ladybirds?
Mark Scheme
3 (1 mark)
Explanation (not marked): The genus is the first word of each scientific name. Coccinella appears twice, and Adalia and Harmonia once each, so there are 3 genera, even though there are 4 ladybird species.
Also accepted / rejected
Also accepted
- Naming the three genera, Coccinella, Adalia and Harmonia, without giving a number
Tips
- Count genera, not species. The genus is the first word of the scientific name, so Coccinella only counts once
- Don’t count the aphid or the plant, because the question asks about ladybirds
Over the last 30 years, many bacteria have been moved into different genera and given new scientific names.
Suggest why.
(1 mark)
Hint
What new evidence can scientists now use to compare bacteria that wasn’t available before?
Mark Scheme
DNA (or RNA) base sequencing, amino acid sequencing, or electron microscopes with greater resolution (1 mark)
Also accepted / rejected
Also accepted
- Genome sequencing
Not accepted
- “Sequencing” without saying base or amino acid sequencing
- “New technology” on its own
- The bacteria having evolved or mutated into new species
Tips
- Name the new evidence: DNA base sequencing, amino acid sequencing, or electron microscopes with greater resolution
- Include the word “base” in base sequencing
- “New technology” is too vague, and the bacteria haven’t changed; our knowledge of them has
A student wanted to find out which pigments are in nettle leaves. She ground some leaves with a solvent to make a pigment extract. She was then given:
- a thin-layer chromatography (TLC) plate
- a pencil and a ruler
- a capillary tube
- a beaker with a lid
- a running solvent (solvent X).
Describe how she could use these to separate the pigments in the extract.
(4 marks)
Hint
Where on the plate does the extract go, and how do you mark that place? Where must the solvent level be? When do you take the plate out?
Mark Scheme
- Draw an origin line in pencil near the bottom of the plate (1 mark)
- Use the capillary tube to put a spot of extract on the origin (1 mark)
- Stand the plate in the beaker with the solvent below the origin (1 mark)
- Remove the plate before the solvent reaches the top, or mark the solvent front (1 mark)
Explanation (not marked): Pencil is used because ink would dissolve in the solvent and separate too. The solvent must start below the origin, or the pigments would dissolve into the solvent in the beaker instead of moving up the plate. Marking the solvent front lets you work out an Rf value for each pigment.
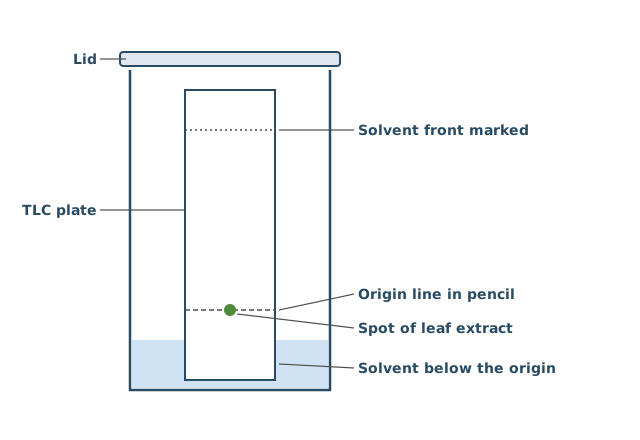
Also accepted / rejected
Also accepted
- All the points shown on a labelled diagram
- Chromatography paper instead of a TLC plate
Tips
- Draw the origin in pencil and put the extract on it. Don’t mix up the extract with the solvent
- The solvent in the beaker must be below the origin
- Take the plate out before the solvent reaches the top, or mark the solvent front
- Use the solvent you are given, not water
A student wanted to find the dry mass of a sample of grass cuttings. She had an oven and a balance.
Describe how the student could use this equipment to find the dry mass of the grass cuttings.
(2 marks)
Hint
How do you remove all the water without burning the grass? How do you know when all the water has gone?
Mark Scheme
- Heat the grass in the oven, then weigh it (1 mark)
- Repeat until the mass stays constant (1 mark)
Also accepted / rejected
Also accepted
- “Heat until the mass stops changing” (both marks)
- Weight for mass
Not accepted
- Burning the grass (point 1)
Tips
- Heat the sample in the oven; don’t burn it, or the biomass is lost
- Keep reweighing until the mass is constant, which shows all the water has gone
- Subtracting the final mass from the starting mass isn’t what’s asked
The student burned 2.00 g of dried grass completely in a calorimeter.
- The calorimeter contained 200 cm³ of water.
- The temperature of the water rose by 15.6 °C.
- 4.18 J of energy raises the temperature of 1 cm³ of water by 1 °C.
Calculate the energy released per gram of dried grass, in kJ g⁻¹.
Show your working.
Answer = ________ kJ g⁻¹
(2 marks)
Hint
Energy = volume × 4.18 × temperature rise. Then convert to kJ and divide by the mass.
Mark Scheme
6.52 kJ g⁻¹ (2 marks)
Working:
- Energy released: 200 × 4.18 × 15.6 = 13 041.6 J
- In kJ: 13 041.6 ÷ 1000 = 13.04 kJ
- Per gram: 13.04 ÷ 2.00 = 6.52 kJ g⁻¹
If the answer is wrong, 1 mark for any of:
- the digits 652 with the decimal point in the wrong place (wrong conversion)
- 13.0 (not divided by 2.00)
- 0.0326 (not multiplied by 200)
- 1.56 (not multiplied by 4.18)
- 0.418 (not multiplied by 15.6)
- 26.1 (multiplied by 2.00 instead of dividing)
Also accepted / rejected
Also accepted
- 6.5 or 7
Tips
- Convert joules to kilojoules by dividing by 1000; this is the most common slip
- Divide by the mass of grass to get kJ per gram
- Show your working, so one error can still earn a mark
A farmer grew lettuces in a glasshouse. During a heatwave, the temperature rose well above the optimum for the lettuces, and they gained less biomass.
Use your knowledge of net primary production to explain why.
(2 marks)
Hint
Write the equation for net primary production. Which part of it would a high temperature change, and in which direction?
Mark Scheme
- NPP = GPP − R (gross primary production minus respiratory losses) (1 mark)
- At the higher temperature, respiration increases, or photosynthesis (GPP) decreases because its enzymes denature (1 mark)
Also accepted / rejected
Not accepted
- Enzymes for both photosynthesis and respiration denaturing (point 2)
- “More energy is used in respiration” (point 2)
Tips
- Give the equation, NPP = GPP − R
- Then link the temperature to one part of the equation. Either respiration increases or photosynthesis decreases. Don’t say both decrease
- If you mention denaturing, say it’s the enzymes for photosynthesis
Here is a woodland food chain.
oak leaves → caterpillars → blue tits → sparrowhawks
Only a small percentage of the energy in the blue tits (secondary consumers) is transferred to the sparrowhawks (tertiary consumers).
Give three reasons why.
(3 marks)
Hint
What happens to the energy the blue tits release in respiration? Does a sparrowhawk eat and digest every part of a blue tit? What else leaves the body?
Mark Scheme
- Energy is lost as heat from respiration by the blue tits (1 mark)
- Not all of each blue tit is eaten (e.g. feathers and bones), or some is not digested and lost in faeces (1 mark)
- Some is lost in excretion (urine or urea) (1 mark)
Also accepted / rejected
Also accepted
- “Faeces” for not digested (point 2)
Tips
- Link heat loss to respiration. Write “heat from respiration”, not just “energy lost as heat”
- Parts not eaten and food not digested count as one reason
- Faeces aren’t excretion. Excretion is urine or urea
- “Energy lost in waste” is too vague
The wheat from a field can be used in two ways.
- People eat the wheat themselves.
- The wheat is fed to chickens, and people eat the chickens.
The same field feeds more people when they eat the wheat themselves.
Explain why.
(2 marks)
Hint
How many trophic levels are there in each case? What happens to energy at each trophic level?
Mark Scheme
- Energy is lost at each trophic level, and feeding the wheat to chickens adds an extra trophic level (1 mark)
- The chickens lose energy as heat in respiration, and in faeces and excretion (1 mark)
Also accepted / rejected
Also accepted
- Energy lost in movement or in keeping warm (point 2)
- A description of a longer food chain (point 1)
Not accepted
- “Energy used in respiration” (point 2)
- Energy “produced” or “made” (point 2)
Tips
- Say energy is lost at each trophic level, and eating the chickens adds an extra level compared with eating the wheat
- Give how it’s lost, such as heat from respiration, movement, faeces or excretion
- Say energy is “lost” or “released” in respiration, not “used in respiration”. Energy is never “produced”
Gardeners make compost from dead plant material such as grass cuttings, leaves and vegetable peelings. When the compost is dug into soil, the recycling of nitrogen-containing compounds from the dead plant material sustains the growth of plants.
Describe the roles of bacteria in this recycling.
(4 marks)
Hint
Start with the nitrogen-containing compounds in dead plant material. Which bacteria turn them into ammonia, and which turn ammonia into the form plants absorb?
Mark Scheme
- Proteins (or amino acids, DNA) are converted to ammonia (ammonium) (1 mark)
- By saprobionts (1 mark)
- Ammonia is converted to nitrite, then to nitrate (1 mark)
- By nitrifying bacteria (1 mark)
Also accepted / rejected
Also accepted
- Another named nitrogen-containing compound, e.g. urea (point 1)
- “Saprotrophs” for saprobionts (point 2)
Not accepted
- The right bacteria linked to the wrong step, e.g. saprobionts making nitrate (points 2 and 4)
Tips
- Name a nitrogen-containing compound in the dead material (e.g. proteins, amino acids, DNA or urea) and say saprobionts convert it into ammonia (ammonium)
- Get the order right. Nitrifying bacteria convert ammonia into nitrite and then into nitrate, not nitrate then nitrite
- Nitrification is an oxidation, not a reduction
- Don’t confuse nitrifying bacteria with nitrogen-fixing bacteria; nitrogen fixation and denitrification aren’t needed here
What earns marks
- Stating that saprobionts decompose dead organic matter
Gardeners make compost from dead plant material. A well-made compost heap is kept moist and is turned regularly with a fork, which lets air into the heap. Heat released by the microorganisms in the heap keeps the inside warm, and garden lime is sometimes added to stop the heap becoming too acidic. In these conditions, the dead plant material decomposes rapidly.
Explain how two abiotic factors in a compost heap enable the rapid rate of recycling.
(2 marks)
Hint
The heap is kept moist, aerated, warm and not too acidic. For each abiotic factor, explain what it does for the enzymes and microorganisms involved in decomposition.
Mark Scheme
Max 2 marks
- A warm temperature increases enzyme activity (and respiration) in the decomposers (1 mark)
- Water is needed for enzyme reactions such as hydrolysis (1 mark)
- A suitable pH is optimum for the enzymes (1 mark)
- Oxygen is needed for aerobic respiration by the saprobionts (and nitrifying bacteria) (1 mark)
Also accepted / rejected
Not accepted
- Water for photosynthesis (point 2)
Tips
- Give two abiotic (non-living) factors, such as temperature, water, pH or oxygen; don’t include a biotic factor
- Explain each one precisely. For example, a high temperature increases enzyme activity (or respiration, nitrification), rather than just “faster decomposition”
- Link water to hydrolysis or enzyme reactions, not to denitrification or photosynthesis
Scientists investigated whether a mycorrhizal fungus increases the yield of wheat. They planted wheat seeds in pots of sterilised soil, and added the fungus to half of the pots.
Suggest three reasons why the soil was sterilised before the seeds were planted.
(3 marks)
Hint
What living things are normally found in soil? Which of them could affect how well the wheat grows, or whether its roots have mycorrhizae?
Mark Scheme
Max 3 marks
- To kill any other mycorrhizal fungi (or other fungi) (1 mark)
- To kill bacteria such as nitrogen-fixing, nitrifying or saprobiotic bacteria (1 mark)
- To kill pathogens (1 mark)
- To kill pests (1 mark)
- To remove competitors (1 mark)
- To kill seeds or spores, such as weed seeds (1 mark)
- So the soil is a controlled variable (1 mark)
Also accepted / rejected
Also accepted
- Disease-causing microorganisms (point 3)
- Saprobionts (point 2)
Not accepted
- “Harmful bacteria” on its own (point 3)
Tips
- Name the organisms that are removed, such as other fungi, pathogens, pests, competitors, weed seeds, or particular bacteria such as nitrogen-fixing bacteria
- “Harmful bacteria” on its own is too vague
- Sterilising doesn’t remove nutrients or change the pH
The light-independent reaction takes place in the stroma of the chloroplast.
Describe how the products of the light-dependent reaction are used in the light-independent reaction to make triose phosphate.
You do not need to describe the role of ribulose bisphosphate (RuBP).
(3 marks)
Hint
Which two products does the light-dependent reaction pass on? What does each one provide, and what happens to GP?
Mark Scheme
- ATP and reduced NADP are used (1 mark)
- ATP provides energy (1 mark)
- GP is reduced to triose phosphate (by reduced NADP) (1 mark)
Also accepted / rejected
Also accepted
- NADPH for reduced NADP (point 1)
- “GP is converted to triose phosphate using reduced NADP” (point 3)
Not accepted
- Reduced NAD (point 1)
Tips
- Name both products, ATP and reduced NADP (not reduced NAD)
- ATP provides energy
- Reduced NADP reduces GP to triose phosphate. This is a reduction, not an oxidation
- If you name GP, get it right (glycerate 3-phosphate), and don’t bring in respiration molecules such as pyruvate
The light-independent reaction (the Calvin cycle) takes place in the stroma of chloroplasts.
Describe how carbon dioxide is converted into triose phosphate in the light-independent reaction, and what happens to the triose phosphate.
(6 marks)
Hint
What does carbon dioxide combine with, and which enzyme catalyses this? What is GP converted into, and which two products of the light-dependent reaction are needed? What happens to the triose phosphate made?
Mark Scheme
- Carbon dioxide combines with ribulose bisphosphate (RuBP) (1 mark)
- This is catalysed by rubisco, and gives two molecules of glycerate 3-phosphate (GP) (1 mark)
- GP is reduced to triose phosphate (1 mark)
- Using reduced NADP (1 mark)
- And energy from ATP (1 mark)
- Triose phosphate is used to regenerate RuBP, or is converted to glucose or another organic substance (1 mark)
Explanation (not marked): Reduced NADP and ATP both come from the light-dependent reaction. Most of the triose phosphate is used to regenerate RuBP, so the cycle can continue, and the rest is used to make glucose and other organic substances.
Also accepted / rejected
Also accepted
- The points shown on a labelled diagram
- NADPH for reduced NADP (point 4)
Not accepted
- Reduced NAD (point 4)
- “Glucose phosphate” for GP (point 2)
Tips
- Carbon dioxide reacts with RuBP, catalysed by rubisco, to give two molecules of GP (glycerate 3-phosphate, not “glucose phosphate”)
- GP is reduced to triose phosphate using reduced NADP (not reduced NAD) and energy from ATP. It’s a reduction, not an oxidation
- Write “triose phosphate” in full at least once, not just “TP”
- Finish with triose phosphate being converted to glucose or RuBP. Don’t describe the light-dependent reaction or the Krebs cycle
A biologist investigated photosynthesis in Chlorella, a single-celled green alga. They:
- measured the percentage of light absorbed by a suspension of Chlorella at different wavelengths
- measured the rate of photosynthesis of Chlorella at each wavelength of light.
Figure 1 shows the results they obtained.
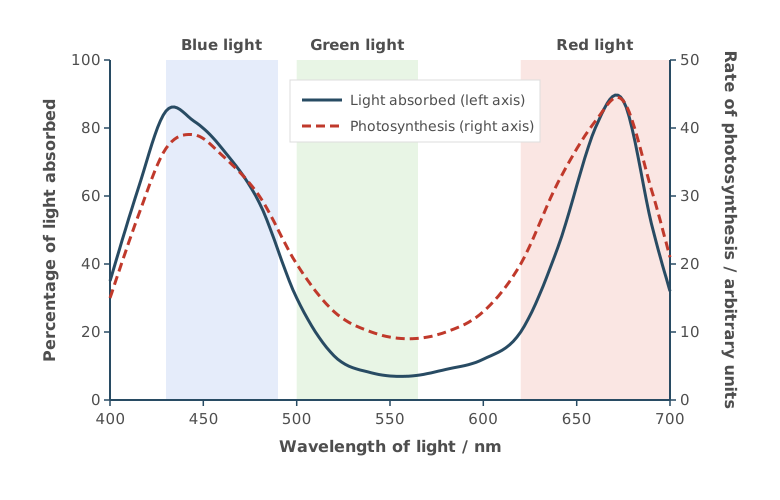
Using Figure 1, what can you conclude about the relationship between:
- the percentage of light absorbed and the rate of photosynthesis
- the colour of light and the rate of photosynthesis.
(2 marks)
Hint
Do the two lines rise and fall together? Which colours of light give a high rate of photosynthesis, and which gives a low rate?
Mark Scheme
- The percentage of light absorbed and the rate of photosynthesis are correlated (both are high at the same wavelengths) (1 mark)
- The rate is higher with blue and red light and lower with green light (1 mark)
Also accepted / rejected
Also accepted
- A description of the correlation, e.g. “when more light is absorbed, the rate is higher” (point 1)
Not accepted
- “No photosynthesis in green light” (point 2)
Tips
- Describe both relationships the question asks for
- For colour, mention all three colours, with a higher rate with blue and red light and a lower rate with green light
- Link green light to the rate of photosynthesis, not just “it is reflected”, and don’t say there is no photosynthesis in green light
- Use the colours, not just wavelengths
What earns marks
- Almost everyone describes the link between light absorbed and the rate of photosynthesis
Fructose is a hexose sugar that cells can use in aerobic respiration:
C₆H₁₂O₆ + 6 O₂ → 6 CO₂ + 6 H₂O
Fructose enters glycolysis and is broken down in the same way as glucose. Respiring one fructose molecule releases six carbon dioxide molecules.
Use your knowledge of the link reaction and Krebs cycle to explain why.
(2 marks)
Hint
How many pyruvate molecules does glycolysis make from one hexose? How many carbon dioxide molecules does each pyruvate release in the link reaction, and in the Krebs cycle?
Mark Scheme
One fructose makes 2 pyruvate, and each pyruvate releases 3 CO₂ (1 in the link reaction and 2 in the Krebs cycle), so 2 × 3 = 6.
Students can explain this in either of two ways (2 marks from one way, not a mix):
Counting per pyruvate
- Each pyruvate releases one CO₂ in the link reaction and two CO₂ in the Krebs cycle (1 mark)
- One fructose gives two pyruvate, so this happens twice (1 mark)
Counting per fructose
- Two CO₂ come from the link reaction (1 mark)
- Four CO₂ come from the Krebs cycle (1 mark)
Also accepted / rejected
Also accepted
- “Decarboxylation” for releasing CO₂
- A labelled diagram
Tips
- Account for all six. Each pyruvate loses 1 CO₂ in the link reaction and 2 in the Krebs cycle, and there are two pyruvate per fructose
- The process is decarboxylation, not carboxylation
- Don’t confuse the Krebs cycle (respiration) with the Calvin cycle (photosynthesis)
Type II diabetes is in remission when a person’s blood glucose concentration stays below the level used to diagnose diabetes for at least 3 months, without any diabetes medication.
Scientists investigated whether a low-calorie diet programme could put type II diabetes into remission.
Give two reasons why a diet programme could be used to treat type II diabetes but not type I diabetes.
(2 marks)
Hint
Compare the two types. Is insulin made? How do the target cells respond to it? What is each type linked to?
Mark Scheme
Max 2 marks
- People with type I diabetes do not produce insulin, or people with type II diabetes still produce insulin (1 mark)
- In type II diabetes, the receptors (cells) are less responsive to insulin (1 mark)
- Type II diabetes is linked to body mass (obesity), but type I is not (1 mark)
Also accepted / rejected
Also accepted
- Type I is caused by an immune response that destroys the β cells (point 1)
- Faulty or fewer insulin receptors in type II (point 2)
- Diet or exercise for body mass (point 3)
Tips
- Type I means no insulin is made. In type II, insulin is still made
- Say the receptors or cells are less responsive to insulin, not “the body”
- Link type II to body mass, diet or exercise, not just “lifestyle”
In a healthy person, all the glucose that is filtered into the nephron is reabsorbed into the blood from the proximal convoluted tubule.
Describe and explain three features of the cells lining the proximal convoluted tubule that allow glucose to be reabsorbed rapidly.
(3 marks)
Hint
Think about the surface of the cells facing the tubule, the transport proteins in their membranes, and the organelles that supply what active transport needs.
Mark Scheme
Max 3 marks. No more than 2 marks can come from points 2 to 4.
Points 2 to 6 need the word “many”. If it’s missing, 1 mark is lost (only once).
- Microvilli give a large surface area (1 mark)
- Many carrier proteins for co-transport of glucose with sodium ions (1 mark)
- Many carrier proteins for active transport of sodium ions out of the cell (1 mark)
- Many channel or carrier proteins for facilitated diffusion of glucose into the blood (1 mark)
- Many mitochondria make ATP for active transport (1 mark)
- Many ribosomes make the carrier proteins (1 mark)
Explanation (not marked): Sodium ions are actively transported out of the cell into the blood, which keeps their concentration low inside the cell. Sodium ions then diffuse in from the tubule through co-transport proteins, carrying glucose with them. Glucose then moves into the blood by facilitated diffusion.
Also accepted / rejected
Also accepted
- Sodium–potassium pumps for carrier proteins for active transport (point 3)
- Lots of rough endoplasmic reticulum for many ribosomes (point 6)
Tips
- Give features of the cells, not of the tubule. “One cell thick” and “a good blood supply” don’t count
- Microvilli (not villi) give a large surface area
- Say “many”, e.g. many mitochondria make ATP for active transport
- Give the role of each transport protein, e.g. carrier proteins for co-transport
When the water potential of the blood falls, more ADH is released.
Describe how ADH affects the collecting duct, and how this changes the amount of water reabsorbed.
(3 marks)
Hint
What does ADH cause to appear in the membranes of the collecting duct cells? How does this change the movement of water, and by which process does water move?
Mark Scheme
- Aquaporins (water channel proteins) move into the cell-surface membrane (1 mark)
- The membrane becomes more permeable to water, so more water is reabsorbed (1 mark)
- By osmosis (1 mark)
Explanation (not marked): Water moves out of the collecting duct into the surrounding tissue of the medulla, which has a lower water potential, and then into the blood.
Also accepted / rejected
Also accepted
- “Channel proteins open” (point 1)
- Water “enters the blood” or “leaves the collecting duct” for reabsorbed (point 2)
Tips
- ADH causes channel proteins (aquaporins) to move into the cell-surface membrane. Include “membrane”
- This increases permeability, so more water is reabsorbed out of the collecting duct (not into it)
- Remember to say “osmosis”
ADH is made by neurones in the hypothalamus.
Name the part of the body that releases ADH into the blood.
(1 mark)
Hint
ADH is made in one place but stored and released somewhere else nearby. Which gland, and which part of it?
Mark Scheme
The posterior pituitary gland (1 mark)
Tips
- ADH is released by the posterior pituitary. Include “posterior”. The hypothalamus makes ADH but doesn’t release it into the blood
Figure 1 shows a drawing of a myelinated motor neurone.
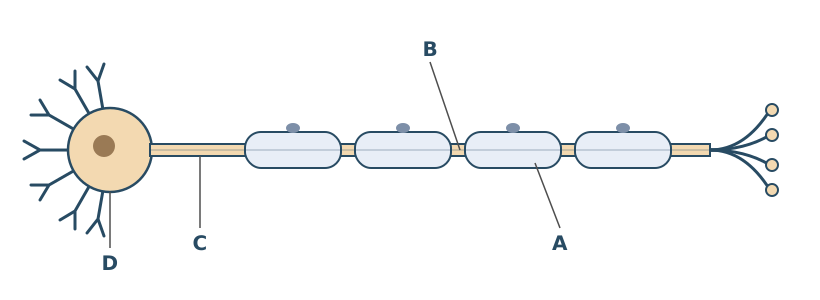
Name the parts labelled A to D.
(2 marks)
Hint
Work along the neurone. Think about the cells that make the sheath, the gaps in the myelin sheath, the long extension, and the part containing the nucleus.
Mark Scheme
4 correct = 2 marks; 2 or 3 correct = 1 mark
- A. Schwann cell
- B. Node of Ranvier
- C. Axon
- D. Cell body
Also accepted / rejected
Also accepted
- “Soma” for cell body (D)
Not accepted
- “Myelin sheath” for A (A is the cell that makes it)
- “Node” on its own for B
Tips
- A is a Schwann cell, not the myelin sheath, a nucleus or another organelle
- B is a node of Ranvier; “node” on its own isn’t enough
- D is the cell body; not the “axon terminal”, “axon head” or a synapse
What earns marks
- Most students name the axon correctly
People with untreated type 1 diabetes often feel very thirsty. One reason is that a high blood glucose concentration causes water to leave body cells.
Explain how a high blood glucose concentration causes body cells to lose water.
Do not refer to ADH or the kidneys in your answer.
(2 marks)
Hint
What does a high glucose concentration do to the water potential of the blood? Which way will water then move, and by what process?
Mark Scheme
- The water potential of the blood decreases (becomes more negative) (1 mark)
- So body cells lose water by osmosis (1 mark)
Also accepted / rejected
Also accepted
- The water potential of the cells is higher than the blood (point 1)
- Water moves into the blood by osmosis (point 2)
Tips
- Say the water potential of the blood decreases; “a concentration gradient” isn’t enough
- Water leaves the cells by osmosis, not diffusion
- Answers about insulin or glucose entering cells don’t score; the question is about water movement
Figure 1 shows one of the physiological systems involved in controlling blood glucose concentration.
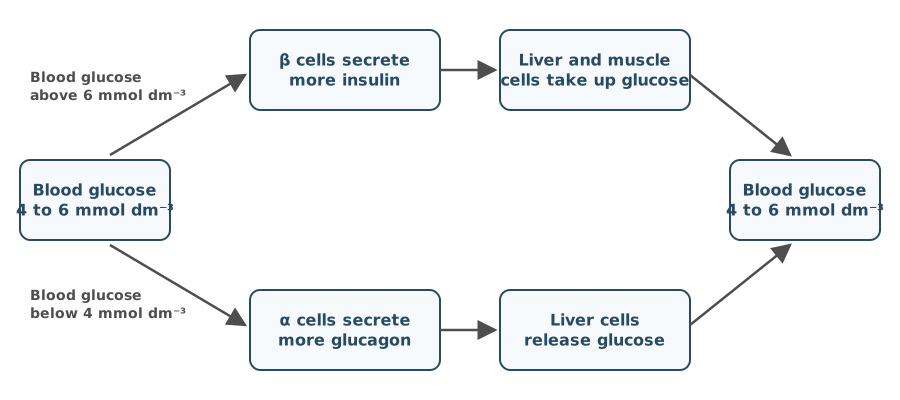
Use the information in Figure 1 to describe how negative feedback works.
(2 marks)
Hint
Negative feedback has two parts. A change is detected, and a response brings the value back. Use Figure 1 to describe both.
Mark Scheme
- A change in blood glucose is detected (by the α or β cells), or separate mechanisms control a rise and a fall (1 mark)
Explanation (not marked): For example, a rise above 6 mmol dm⁻³ is detected by the β cells, which secrete more insulin; a fall below 4 mmol dm⁻³ is detected by the α cells, which secrete more glucagon. - The response (cells taking up glucose, or the liver releasing glucose) returns blood glucose to the norm (4 to 6 mmol dm⁻³) (1 mark)
Explanation (not marked): For example, after a rise, insulin makes liver and muscle cells take up glucose, so blood glucose falls back to 4 to 6 mmol dm⁻³. After a fall, glucagon makes liver cells release glucose, so it rises back.
Also accepted / rejected
Also accepted
- “Set point” or “optimum” for norm (point 2)
- Any value from 4 to 6 mmol dm⁻³ (point 2)
Tips
- Say how the change is detected. A change in blood glucose is detected by the α or β cells
- Then say the response returns the blood glucose to the norm (4 to 6 mmol dm⁻³)
- You only need to describe one direction (an increase or a decrease)
What earns marks
- Most students gain the mark for the value returning to the norm or set point
Figure 1 shows one of the physiological systems involved in controlling blood pH.
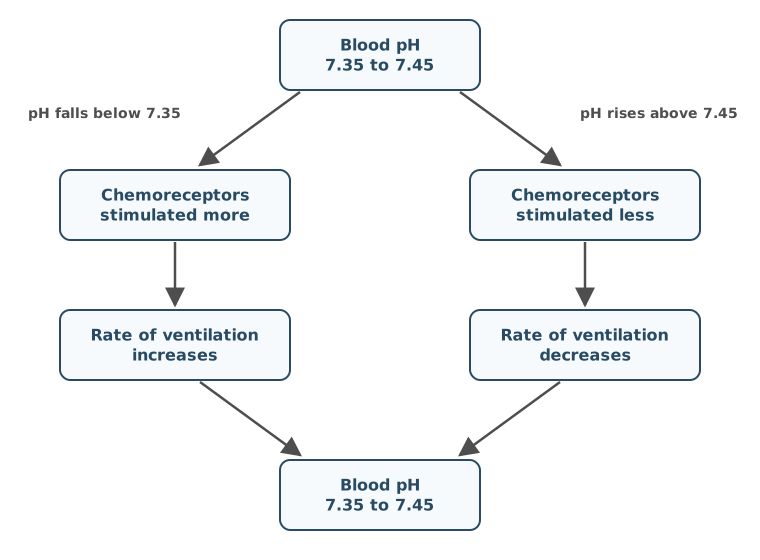
Running a 400 m race causes a change in blood pH.
Use Figure 1 to describe and explain the changes in blood pH and in the rate of ventilation.
(2 marks)
Hint
What does running do to the rate of respiration, and what does that produce? Then follow the left-hand route of Figure 1.
Mark Scheme
- More respiration produces more carbon dioxide, or anaerobic respiration produces lactate (1 mark)
Explanation (not marked): During the race, the leg muscles respire faster, so more carbon dioxide enters the blood. It forms an acid in the blood that releases H⁺ ions, lowering the pH. - The blood pH falls, so the chemoreceptors are stimulated more and the rate of ventilation increases (1 mark)
Explanation (not marked): For example, blood pH falls below 7.35, so ventilation increases; more carbon dioxide is breathed out and the pH returns to 7.35 to 7.45.
Also accepted / rejected
Also accepted
- “Lactic acid” for lactate (point 1)
- More H⁺ (more acidic), or a pH below 7.35 (point 2)
Not accepted
- Anaerobic respiration producing lactate and carbon dioxide (point 1)
Tips
- Start with respiration. More respiration produces more carbon dioxide (or anaerobic respiration produces lactate)
- In humans, anaerobic respiration produces lactate only, not lactate and carbon dioxide
- More carbon dioxide lowers the blood pH; it doesn’t increase it
- Mention both chemoreceptors and ventilation. The lower pH increases stimulation of the chemoreceptors, which increases the rate of ventilation
- Heart rate isn’t relevant here
A sprinter’s leg muscles use ATP very quickly during a race.
Describe three roles of ATP in muscle contraction.
(3 marks)
Hint
What has to happen to the cross-bridge before myosin can bind again? What resets the myosin head? What happens to calcium ions when the muscle relaxes?
Mark Scheme
Max 3 marks
- ATP is used to break the actinomyosin cross-bridge (detach myosin from actin) (1 mark)
- ATP is used to move the myosin head back (recock it) (1 mark)
- So the actin filaments are pulled along in the next power stroke (1 mark)
- ATP is used for the active transport of calcium ions back into the sarcoplasmic reticulum (1 mark)
Explanation (not marked): ATP binds to the myosin head and breaks the cross-bridge. Its hydrolysis releases energy that moves the head back, ready to bind further along the actin. When the muscle relaxes, calcium ions are pumped back into the sarcoplasmic reticulum by active transport, which also uses ATP.
Also accepted / rejected
Also accepted
- “To form actinomyosin”, or “to attach or detach myosin and actin” (point 1)
- “To change the shape of the myosin head” (point 2)
Not accepted
- “Active site” (point 1, as it’s a binding site)
Tips
- ATP breaks the actinomyosin cross-bridges. Write “myosin”, not “myofibril”
- ATP moves the myosin head (include “head”), which pulls the actin
- ATP is also used to actively transport calcium ions back into the sarcoplasmic reticulum
- Call it a binding site, not an active site
Scientists took small samples from the leg muscles of sprinters and of long-distance runners. The sprinters’ samples contained mostly fast muscle fibres. They had a higher concentration of glycogen than the long-distance runners’ samples, which contained mostly slow muscle fibres.
Explain how this difference in glycogen concentration is related to the different properties of fast and slow muscle fibres.
(4 marks)
Hint
How quickly does each type of fibre contract, and for how long? Which type of respiration does each mainly use, and how much ATP does that give per glucose? Where does the glucose come from?
Mark Scheme
- Fast fibres contract quickly but slow fibres contract slowly, or fast fibres are used for short periods but slow fibres for long periods (1 mark)
- Fast fibres mainly use anaerobic respiration, or slow fibres use aerobic respiration (1 mark)
- Fast fibres produce ATP quickly, or anaerobic respiration gives less ATP per glucose than aerobic respiration (1 mark)
- Glycogen is a store of glucose, which is hydrolysed to glucose (glycogenolysis) (1 mark)
Explanation (not marked): Fast fibres contract quickly, in short bursts such as sprinting. They mainly respire anaerobically, which makes ATP quickly but gives only a little ATP from each glucose. So they use up glucose fast, and they keep a large store of it as glycogen. Slow fibres contract slowly over long periods. They respire aerobically, which gives much more ATP from each glucose, so they need less stored glycogen.
Also accepted / rejected
Also accepted
- Examples such as sprinting (short) and marathon running (long) (point 1)
- “Release energy” for produce ATP (point 3)
Not accepted
- “Produce energy” (point 3)
Tips
- Compare both fibre types in each point, for example fast fibres contract quickly whereas slow fibres contract slowly
- Say fast fibres use anaerobic respiration. “Work anaerobically” isn’t accepted
- Link to ATP. Fast fibres produce ATP quickly, and anaerobic respiration gives less ATP per glucose. Energy is released, not “produced”
- Glycogen is a store of glucose that is hydrolysed to glucose (glycogenolysis). Don’t confuse this with glycolysis or glycogenesis
A 100 m sprinter takes creatine supplements during training. A marathon runner eats extra carbohydrate for a few days before a race, which is called carbohydrate loading.
Describe and explain how each of these can improve the performance of the type of muscle fibre used most in each race.
(5 marks)
Hint
Which type of fibre does each race mainly use? What does creatine become in muscle, and how does that help with ATP? What happens to the extra carbohydrate, and how is it used later?
Mark Scheme
Max 5 marks. No more than 3 marks can come from points 3 to 7.
Muscle fibres
- Fast fibres are used in short, intense exercise, such as a sprint (1 mark)
- Slow fibres are used in long exercise, such as a marathon (1 mark)
Creatine
- Creatine is used to make phosphocreatine (1 mark)
- Phosphocreatine provides phosphate to ADP to make ATP quickly (1 mark)
Carbohydrate loading
- The extra carbohydrate is stored as glycogen (glycogenesis) (1 mark)
- Glycogen is hydrolysed to glucose (glycogenolysis) (1 mark)
- The glucose is used in respiration to make ATP (1 mark)
Also accepted / rejected
Also accepted
- “Fast-twitch” and “slow-twitch” fibres (points 1 and 2)
- “Glycolysis” for respiration (point 7)
Tips
- Link the fibre type to the exercise. Fast fibres are used for short, intense exercise and slow fibres for long exercise, not “aerobic” or “anaerobic exercise”
- Creatine forms phosphocreatine, which gives phosphate to ADP to make ATP. Write phosphocreatine in full
- Carbohydrate is stored as glycogen (not starch), which is hydrolysed to glucose for respiration
- Don’t confuse glycogen with glucagon, or mix up glycogenesis, glycogenolysis and glycolysis
At a cholinergic synapse between two neurones in the spinal cord, nerve impulses only pass in one direction.
Give two reasons why.
(2 marks)
Hint
Which neurone releases the neurotransmitter? Which membrane has the receptors for it?
Mark Scheme
- Only the presynaptic neurone releases acetylcholine (has vesicles of it) (1 mark)
- Only the postsynaptic membrane has acetylcholine receptors (1 mark)
Also accepted / rejected
Also accepted
- “There are no receptors on the presynaptic membrane” (point 2)
Tips
- Only the presynaptic neurone releases acetylcholine, and only the postsynaptic membrane has receptors
- Vesicles alone, the refractory period or sodium ions don’t answer it, because both neurones have sodium ion channels
A single presynaptic neurone was stimulated four times in quick succession. Figure 1 shows the changes in membrane potential in the postsynaptic neurone.
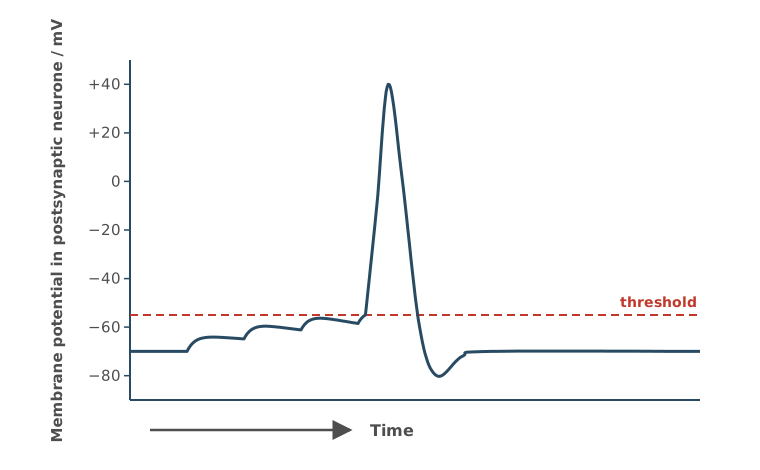
Name and explain the type of summation shown in Figure 1.
(2 marks)
Hint
How many presynaptic neurones are involved in Figure 1? What builds up with each impulse until threshold is reached?
Mark Scheme
- Temporal summation (1 mark)
- Repeated impulses from one neurone in a short time release enough acetylcholine for the postsynaptic membrane to reach threshold (1 mark)
Explanation (not marked): Each impulse releases a little neurotransmitter, which causes a small depolarisation that isn’t enough on its own. The impulses arrive close together, so each depolarisation adds to the last before it fades, until threshold is reached and an action potential is produced.
Also accepted / rejected
Also accepted
- “Enough sodium ions enter to reach threshold” (point 2)
- Depolarisation, or an action potential, for reaching threshold (point 2)
Tips
- It’s temporal summation, which means repeated impulses from one neurone in a short time
- Explain what builds up. Enough acetylcholine is released, or enough sodium ions enter, to reach threshold. “Many impulses reach threshold” isn’t enough
GABA is a neurotransmitter released at some inhibitory synapses in the brain. When GABA binds to its receptors, the postsynaptic neurone becomes hyperpolarised.
Explain how hyperpolarisation makes it less likely that an action potential is produced in the postsynaptic neurone.
(2 marks)
Hint
What happens to the potential inside the postsynaptic neurone? What then has to happen before the threshold is reached?
Mark Scheme
- The inside of the postsynaptic neurone becomes more negative (the potential is below the resting potential) (1 mark)
- So more sodium ions must enter to reach the threshold for depolarisation (an action potential) (1 mark)
Also accepted / rejected
Also accepted
- A greater potential difference across the membrane (point 1)
- Na⁺ for sodium ions (point 2)
Not accepted
- “The potential difference decreases” (point 1)
Tips
- Say the inside of the postsynaptic neurone becomes more negative than the resting potential
- Then explain the effect. More sodium ions must enter to reach the threshold
- Write “sodium ions”, not just “sodium”. Sodium ions enter the neurone; they don’t leave it
What earns marks
- Explaining the more negative inside by chloride ions entering or potassium ions leaving
A nerve impulse arrives at a neuromuscular junction in the diaphragm, and acetylcholine is released from the motor neurone.
Describe the sequence of events, after acetylcholine is released, that leads to the muscle fibre being stimulated to contract.
Do not describe what happens after calcium ions are released in the muscle fibre.
(4 marks)
Hint
How does acetylcholine cross the gap, and where does it bind? Which ions then enter, and what does that cause? Which store inside the muscle fibre releases calcium ions?
Mark Scheme
The points must be in the right order (1 mark is lost if they are not).
- Acetylcholine diffuses across the synaptic cleft (1 mark)
- It binds to receptors on the sarcolemma (1 mark)
- Sodium ions enter, causing depolarisation (an action potential) (1 mark)
- Calcium ions are released from the sarcoplasmic reticulum (1 mark)
Also accepted / rejected
Also accepted
- “Postsynaptic membrane” for sarcolemma (point 2)
- Na⁺ for sodium ions (point 3)
- “Endoplasmic reticulum” for sarcoplasmic reticulum (point 4)
Not accepted
- “Sodium ion channels open” without saying that sodium ions enter (point 3)
Tips
- Start after acetylcholine is released, as the question says
- Acetylcholine diffuses across the cleft. The vesicles don’t cross it
- Say where the receptors are, on the sarcolemma (postsynaptic membrane), not just “on the muscle”
- Say that sodium ions enter, not just that channels open, and link this to depolarisation
- Calcium ions are released from the sarcoplasmic reticulum, not taken up by it. Stop there, as the question says
Glutamate is a neurotransmitter at many of the synapses that carry nerve impulses from pain receptors towards the brain. Pregabalin is a drug used to treat long-lasting nerve pain. Pregabalin binds to the calcium ion channels in the presynaptic neurone at some of these synapses, so fewer of the channels open.
Transmission at synapses that use glutamate is similar to transmission at synapses that use acetylcholine.
Explain how pregabalin reduces nerve pain.
(5 marks)
Hint
Start with what happens to the calcium ions. What do calcium ions normally trigger, and what follows at the postsynaptic neurone? Say what is reduced at each step.
Mark Scheme
Say what is reduced (no, fewer or less). An answer that only describes normal synaptic transmission scores max 4 marks.
- Fewer calcium ions enter the synaptic knob (1 mark)
- So fewer vesicles fuse with the presynaptic membrane, and less glutamate is released (1 mark)
- Less glutamate diffuses across the synaptic cleft (1 mark)
- Less glutamate binds to receptors on the postsynaptic membrane (1 mark)
- Fewer sodium ions enter the postsynaptic neurone, so fewer impulses are sent to the brain (1 mark)
Also accepted / rejected
Also accepted
- Ca²⁺ for calcium ions (point 1)
- “Presynaptic neurone” for synaptic knob (point 1)
- “Neurotransmitter” for glutamate (points 2 to 4)
- No depolarisation, or the threshold isn’t reached, for fewer impulses (point 5)
Not accepted
- “Presynaptic membrane” on its own for where calcium ions enter (point 1)
- “Signals” or “messages” for impulses (point 5)
Tips
- Say what is reduced at each step (no, fewer or less). Describing normal synaptic transmission only scores 4 marks
- Fewer calcium ions enter the synaptic knob, not the “synapse” or the “presynaptic membrane”
- Fewer vesicles fuse with the presynaptic membrane, so less glutamate is released and diffuses across the cleft
- Less glutamate binds to receptors on the postsynaptic membrane. Include both “receptors” and “membrane”
- Finish with fewer sodium ions entering the postsynaptic neurone, so fewer impulses reach the brain. Don’t stop at sodium ion channels opening
In mice, a gene for coat colour has a dominant allele for yellow coat, Y, and a recessive allele for grey coat, y. Mice that are homozygous dominant (YY) do not survive beyond the embryo stage. A second gene, on a different pair of chromosomes, controls fur length. The allele for short fur, L, is dominant to the allele for long fur, l.
A yellow mouse that was homozygous for short fur was crossed with a yellow, long-furred mouse.
Complete the genetic diagram to show all the possible genotypes and the ratio of phenotypes expected to develop into adults from this cross.
| Parental phenotypes | yellow, short fur | yellow, long fur |
| Parental genotypes | ________ | ________ |
| Gametes | ________ | ________ |
| Offspring genotypes | ________ | |
| Phenotypes of offspring that develop into adults | ________ | |
| Ratio of these phenotypes | ________ |
(3 marks)
Hint
Set up the dihybrid cross correctly. Remember to leave out any genotypes that don’t survive (as stated in the question) when working out the final ratio.
Mark Scheme
Walkthrough
Step 1: parent genotypes. Yellow mice must be Yy, because YY mice die as embryos. The first mouse is homozygous short-furred (LL); the second is long-furred (ll). So the cross is YyLL × Yyll.
Step 2: gametes. YyLL makes YL and yL. Yyll makes Yl and yl.
Step 3: Punnett square.
Gametes from YyLL
Gametes from Yyll
| YL | yL | |
|---|---|---|
| Yl | YYLldies as an embryo | YyLlyellow, short |
| yl | YyLlyellow, short | yyLlgrey, short |
Step 4: count only the mice that survive to adults. YYLl dies, leaving 2 yellow short-furred and 1 grey short-furred, a ratio of 2 : 1.
All the offspring have short fur, because one parent can only give L. The key idea is the lethal genotype, which turns the 3 : 1 you’d expect for coat colour into 2 : 1.
Mark scheme
- Parent genotypes YyLL and Yyll (1 mark)
- Offspring genotypes YyLl (×2), yyLl (and YYLl) (1 mark)
- Phenotypes yellow, short fur and grey, short fur, in the ratio 2 : 1 (1 mark)
If the parent genotypes are wrong, 1 mark for the correct offspring genotypes from them.
Also accepted / rejected
Also accepted
- Alleles in any order, e.g. YLyL (points 1 and 2)
- Other letters for the alleles
- Ratios equivalent to 2 : 1 (point 3)
Tips
- Read the extra condition. Mice homozygous for yellow (YY) die, so leave them out of the phenotypes and ratio
- The correct ratio is 2 yellow short-furred : 1 grey short-furred, not 3 : 1 or 1 : 2 : 1
- Get the parent genotypes right (YyLL and Yyll) before drawing the cross
What earns marks
- The parent and offspring genotypes are the marks most often gained
In tomato plants, the T allele for tall stems is dominant to the t allele for dwarf stems. The R allele for round fruit is dominant to the r allele for oval fruit.
A scientist carried out a genetic cross between a tall plant with round fruit (heterozygous for both genes) and a dwarf plant with oval fruit.
Table 1 shows the results of this cross.
Table 1
| Phenotype of offspring | Percentage of offspring |
|---|---|
| Tall, round fruit | 46.2 |
| Dwarf, oval fruit | 45.4 |
| Tall, oval fruit | 4.3 |
| Dwarf, round fruit | 4.1 |
Use your knowledge of autosomal linkage to explain the results in Table 1.
Your answer should include:
- an explanation of what is meant by autosomal linkage
- a comment about the relative proportions of the different genotypes of gametes produced in this cross.
(3 marks)
Hint
If the two genes are on the same autosome, which combinations of alleles stay together in the gametes of the heterozygous parent? How could the rarer offspring arise?
Mark Scheme
Walkthrough
Step 1: what you’d expect if the genes weren’t linked. This is a test cross (TtRr × ttrr), so you’d expect 1 : 1 : 1 : 1, about 25% of each phenotype.
Step 2: what actually happened. Almost all the offspring (46.2% + 45.4%) have the parents’ combinations (tall with round fruit, or dwarf with oval fruit). Only about 8% have new combinations.
Step 3: explain with linkage (mark 1). The genes are linked, which means they are on the same autosome, with T and R on one chromosome and t and r on the other. So they’re usually inherited together.
Step 4: explain the gametes (mark 3). The heterozygous plant makes mostly TR and tr gametes, and only a few Tr and tR gametes.
Step 5: explain the few new combinations (mark 2). The few Tr and tR gametes are made by crossing over between the two genes in meiosis. The offspring they produce are recombinants.
The linkage figure above shows these gametes.
Mark scheme
- The genes are on the same autosome (chromosome) (1 mark)
- Crossing over (recombination) (1 mark)
- More TR and tr gametes, fewer Tr and tR gametes (1 mark)
Also accepted / rejected
Also accepted
- “Alleles of different genes on the same chromosome” (point 1)
- “Chiasmata” for crossing over (point 2)
Not accepted
- “Alleles on the same chromosome” without saying they belong to different genes (point 1)
Tips
- Define autosomal linkage precisely. The two genes are on the same autosome. “Alleles” (unqualified) or “traits” on the same chromosome isn’t enough
- Comment on the gametes, not the offspring. The heterozygous parent produces mostly TR and tr gametes, and only a few Tr and tR gametes
- Explain the few Tr and tR gametes by crossing over
What earns marks
- Crossing over is the point most often credited
In cats, two genes control fur colour.
- A gene on the X chromosome: the allele XG gives ginger fur and the allele XB gives black fur. These alleles are codominant, so XGXB females have ginger and black patches (tortoiseshell).
- Gene F, which is not on a sex chromosome: the dominant allele F stops any pigment forming, so cats with at least one F allele are white. Cats that are ff show the colour from the gene on the X chromosome.
A black female cat was crossed with a white male cat.
Complete the genetic diagram to show all the possible genotypes and the ratio of phenotypes expected in the offspring of this cross.
| Parental phenotypes | black female | white male |
| Parental genotypes | XBXBff | XGYFf |
| Gametes | ________ | ________ |
| Offspring genotypes | ________ | |
| Offspring phenotypes | ________ | |
| Ratio of offspring phenotypes | ________ |
(3 marks)
Hint
Each of the male’s gametes gets one sex chromosome and one allele of gene F. How many different gametes can he make? Include the sex in every offspring phenotype.
Mark Scheme
Walkthrough
Step 1: what each gene does. F stops pigment forming, so any cat with an F allele is white, whatever its colour alleles (dominant epistasis). Only ff cats show their colour. An XGXB female is tortoiseshell, and a male (one X) is either ginger or black.
Step 2: gametes.
- The black female, XBXBff, can only make XBf
- The white male, XGYFf, makes XGF, XGf, YF and Yf
Step 3: Punnett square.
Gamete from the female (XBXBff)
Gametes from the male (XGYFf)
| XBf | |
|---|---|
| XGF | XBXGFfwhite female |
| XGf | XBXGfftortoiseshell female |
| YF | XBYFfwhite male |
| Yf | XBYffblack male |
Step 4: phenotypes and ratio. White female : tortoiseshell female : white male : black male = 1 : 1 : 1 : 1. Include the sex in every phenotype.
Mark scheme
- Gametes XBf from the female, and XGF, XGf, YF and Yf from the male (1 mark)
- Offspring XBXGFf, XBXGff, XBYFf and XBYff (1 mark)
- White female, tortoiseshell female, white male and black male, in the ratio 1 : 1 : 1 : 1 (1 mark)
If the gametes are wrong, 1 mark for the correct offspring genotypes from them.
Also accepted / rejected
Also accepted
- g and b instead of G and B (points 1 and 2)
- Alleles in any order, or a Punnett square (points 1 and 2)
- Equivalent ratios, e.g. 4 : 4 : 4 : 4 (point 3)
- “Ginger and black” for tortoiseshell, and “no pigment” for white (point 3)
Tips
- Write the gametes first. The female makes only XBf, and the male makes XGF, XGf, YF and Yf
- Include the sex in every phenotype (white female, tortoiseshell female, white male, black male)
- Don’t combine white males and white females. The ratio is 1 : 1 : 1 : 1, not 2 : 1 : 1
In genetic crosses, the observed phenotypic ratios in the offspring are often not the same as the expected ratios.
Suggest two reasons why.
Do not refer to sex-linkage or autosomal linkage in your answer.
(2 marks)
Hint
Think about chance events when gametes fuse, genes that affect each other’s expression, and how many offspring were counted.
Mark Scheme
Walkthrough
You can’t use linkage here, so think about chance first, then about other gene effects:
Chance:
- Small sample size: with only a few offspring, chance has a big effect on the numbers
- Random fertilisation: which gametes fuse is down to chance
- Crossing over: where chiasmata form in meiosis is random, so some gametes get new combinations of alleles
Other effects on the ratio:
- Epistasis: one gene masks another, so phenotype groups merge
- Lethal genotypes: some offspring die before they’re counted
- Epigenetics: the environment changes gene expression
Any two of these score. Don’t say mutation, because it happens far too rarely to change a ratio.
Mark scheme
Max 2 marks
- Small sample size (1 mark)
- Crossing over (1 mark)
- Random fertilisation of gametes (1 mark)
- Epistasis (1 mark)
- Lethal genotypes (1 mark)
- Epigenetics (1 mark)
Also accepted / rejected
Also accepted
- “Random fusion of gametes” (point 3)
Tips
- Don’t give mutation, because mutations are too rare to change phenotypic ratios. Independent segregation doesn’t gain the mark either
- Say “random fertilisation” (random fusion of gametes), not “random mating”
What earns marks
- Crossing over, random fertilisation and small sample size are the most common correct answers; epistasis, epigenetics and lethal genotypes are also credited
Differences in flower colour are thought to be one of the factors in the evolution of two closely related species of mountain plant.
- Species A has white flowers. It is mostly found at higher altitudes (1200 to 2400 metres) and is pollinated by hawkmoths.
- Species B has orange flowers. It is mostly found at lower altitudes (up to 1500 metres) and is pollinated by butterflies.
Hawkmoths and butterflies transfer pollen between flowers. Pollination involves the transfer of male gametes to female gametes.
Explain the different processes that may have been involved in the evolution of these two species. Use the information provided to justify your answer.
(5 marks)
Hint
What could keep the two populations apart, and is that true everywhere they grow? What would happen to the alleles in each population over time?
Mark Scheme
Max 5 marks. Point 4 is only given if point 3 is given.
Allopatric speciation
- Geographical isolation caused by the different altitudes (1 mark)
- So allopatric speciation (1 mark)
Sympatric speciation
- However, the ranges overlap (1200 to 1500 m), so both species grow at some of the same altitudes (1 mark)
- So sympatric speciation is also possible (1 mark)
How the two species formed
- Mutations produce variation, e.g. in flower colour (1 mark)
- Different selection pressures, or different environments (e.g. temperature) (1 mark)
- Reproductive isolation (separate gene pools) because of different pollinators or different altitudes (1 mark)
- The allele frequencies change in each population (1 mark)
- Eventually they can no longer interbreed to produce fertile offspring (1 mark)
Also accepted / rejected
Also accepted
- Selection on flower colour (point 6)
- A named abiotic factor, e.g. temperature or humidity (point 6)
- “No gene flow” for separate gene pools (point 7)
Not accepted
- “Different altitudes” on its own for different environments (point 6)
- Mutations caused by the environment, or “mutating to adapt” (point 5)
Tips
- Use the information. Different altitudes cause geographical isolation (allopatric speciation), but the ranges overlap (1200 to 1500 m), so sympatric speciation is also possible
- Link the isolation to altitude, not to mountains or rivers. For different environments, name a factor such as temperature, because “different altitudes” alone isn’t enough
- Mutations arise randomly. Don’t say the environment causes them
- Say the reproductive isolation is due to different pollinators, rather than just repeating the stem
- Finish with a change in allele frequencies until they can no longer interbreed to produce fertile offspring
Explain what is meant by the phenotype of an organism.
(2 marks)
Hint
A phenotype has two influences. What are they?
Mark Scheme
Walkthrough
Phenotype has two parts, and each one is a mark:
- It’s the expression of the genotype (the alleles the organism has)
- …and its interaction with the environment
Mark scheme
- The characteristics of an organism resulting from its genotype (its alleles) (1 mark)
- And from the interaction of the genotype with the environment (1 mark)
Also accepted / rejected
Also accepted
- A named characteristic (point 1)
- “Genes” or “DNA” for genotype (point 1)
Tips
- Include both influences. The phenotype is the expression of the genotype and its interaction with the environment
- “The appearance of a characteristic” on its own is not enough
- Don’t confuse phenotype with proteome
In guinea pigs, a gene for coat colour has a dominant allele for black coat, B, and a recessive allele for brown coat, b.
Explain how you would determine if the genotype of a black guinea pig is homozygous or heterozygous for coat colour.
(2 marks)
Hint
To determine if a dominant phenotype is homozygous or heterozygous, what genotype should you cross it with? What offspring ratios would you expect?
Mark Scheme
Walkthrough
Step 1: choose the cross. Cross the black guinea pig with a brown guinea pig. Brown is recessive, so a brown guinea pig must be bb (homozygous recessive). This is a test cross. The brown guinea pig can only give b alleles, so the offspring show which alleles the black guinea pig passed on.
Step 2: work out both possibilities.
If the black guinea pig is BB, every offspring gets a B from it:
Black guinea pig (BB)
Brown guinea pig (bb)
| B | B | |
|---|---|---|
| b | Bbblack | Bbblack |
| b | Bbblack | Bbblack |
If the black guinea pig is Bb, half the offspring get its b allele:
Black guinea pig (Bb)
Brown guinea pig (bb)
| B | b | |
|---|---|---|
| b | Bbblack | bbbrown |
| b | Bbblack | bbbrown |
Step 3: conclude. If any brown offspring appear, the black guinea pig was Bb (heterozygous). If all the offspring are black, it was BB (homozygous).
Mark scheme
- Cross it with a brown (homozygous recessive, bb) guinea pig (1 mark)
- If any brown offspring are produced, it is heterozygous (Bb), or if all the offspring are black, it is homozygous (BB) (1 mark)
Also accepted / rejected
Also accepted
- A cross with a heterozygous guinea pig (point 1)
- Instead of a cross, sequencing the DNA and comparing the base sequence with the known alleles (both marks)
- Instead of a cross, separating the alleles by electrophoresis and identifying them with DNA probes (both marks)
Tips
- Cross the black guinea pig with a brown (homozygous recessive) one; crossing two black guinea pigs doesn’t work
- Explain how the offspring show the genotype. Any brown offspring means heterozygous, and all black means homozygous
- “Look at the parents” or “use a Punnett square” isn’t a method
In a species of beetle, males are XY and females are XX. A gene for body colour has a dominant allele for green body, G, and a recessive allele for brown body, g.
A cross between a green-bodied male beetle and a brown-bodied female beetle produced some brown-bodied females.
Explain how this shows that the gene for body colour is not sex-linked.
(1 mark)
Hint
If the gene is on the X chromosome, what allele(s) would the male parent have? What would this mean for female offspring?
Mark Scheme
Walkthrough
Imagine the gene is on the X chromosome, and show that the results couldn’t happen.
If it were sex-linked:
- The green male would be XGY. He has only one X, and it carries the green allele
- The brown female would be XgXg
- Every daughter gets her father’s X, so every daughter would get XG
Green male (XGY)
Brown female (XgXg)
| XG | Y | |
|---|---|---|
| Xg | XGXggreen female | XgYbrown male |
| Xg | XGXggreen female | XgYbrown male |
So all the daughters would be green, and none would be brown. But the cross produced brown females, so the gene can’t be on the X chromosome.
Mark scheme
If the gene were sex-linked, the green male would pass his XG (the dominant, green allele) to all his daughters, so no daughters would be brown (1 mark)
Also accepted / rejected
Also accepted
- If sex-linked, the green male could not be heterozygous
- If sex-linked, only a brown male could have a brown daughter
Tips
- Explain what would happen if the gene were sex-linked. The green male passes his X (with the green allele) to all his daughters, so no daughters would be brown
- It’s the daughters that would all be green, not all the offspring
- Sex-linked genes are on the X chromosome, not the Y
What earns the mark
- Stating that no female offspring would be brown
In humans, polydactyly (having extra fingers or toes) is controlled by a gene with two alleles. The allele for polydactyly, P, is dominant to the allele for the usual number of digits, p.
The gene is not sex-linked.
Figure 1 shows the inheritance of polydactyly in one family.
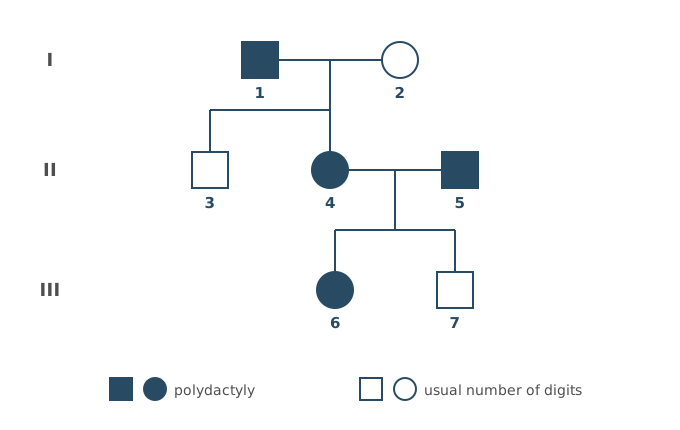
Explain one piece of evidence from Figure 1 that the allele for polydactyly is dominant.
(2 marks)
Hint
Find two parents with polydactyly who have a child without it. What must both parents carry?
Mark Scheme
Walkthrough
Step 1: find two parents with the same phenotype whose child is different. Individuals 4 and 5 both have polydactyly (shaded), but their son 7 does not (not shaded).
Step 2: explain it with alleles. 7 must have got an allele for the usual number of digits from each parent. So 4 and 5 both carry this allele without showing it, so it must be recessive, and both 4 and 5 are heterozygous (Pp).
Always name the individuals you are using, then explain in terms of alleles.
Mark scheme
- Two parents with polydactyly (4 and 5) have a child without it (7) (1 mark)
- So both 4 and 5 must carry the recessive allele (both are heterozygous) (1 mark)
Also accepted / rejected
Also accepted
- “If polydactyly were recessive, all the children of 4 and 5 would have it” (point 2)
- “Affected” for polydactyly and “unaffected” for the usual number of digits (points 1 and 2)
Tips
- Use individuals 4 and 5. Two parents with polydactyly have a child without it (7)
- So both 4 and 5 must carry the recessive allele (both heterozygous), not just one of them
- Read the diagram carefully. 4 and 5 are partners, and 5 is not a child of 1 and 2
Cystic fibrosis is an autosomal recessive condition.
Two parents are both heterozygous for the cystic fibrosis allele.
Calculate the probability of these parents having a daughter who has cystic fibrosis.
Probability = ________
(1 mark)
Hint
Work out the chance of a child having cystic fibrosis from the cross, then the chance of that child being a daughter. Multiply the two.
Mark Scheme
Walkthrough
Step 1: the condition. It’s autosomal, so being male or female doesn’t change the alleles. Both parents are heterozygous:
Gametes from parent 1 (Ff)
Gametes from parent 2 (Ff)
| F | f | |
|---|---|---|
| F | FFunaffected | Ffunaffected |
| f | Ffunaffected | ffcystic fibrosis |
Probability of a child with cystic fibrosis (ff) = 1/4
Step 2: the sex. Probability of the child being a daughter = 1/2
Step 3: both must happen, so multiply: 1/4 × 1/2 = 1/8 (0.125 or 12.5%)
The most common wrong answer is 25%. That’s the chance of any child having the condition, not of a daughter having it.
Mark scheme
1/8 (0.125 or 12.5%) (1 mark)
Also accepted / rejected
Also accepted
- 1 in 8
Not accepted
- A ratio such as 1 : 8
- 12.5 without the % sign
Tips
- Include the chance of having a daughter, so 1/4 (affected) × 1/2 (daughter) = 1/8. 0.25 is the most common wrong answer
- Give a probability as a fraction, decimal or percentage (1/8, 0.125 or 12.5%), not a ratio such as 1 : 8, and include the % sign
In wheat fields, wild oat plants can grow up to a height of 1.5 m and absorb large quantities of nutrients from the soil.
Wild oats have a negative effect on the growth of wheat plants.
Use the information provided to explain why.
In your answer, name the type of competition occurring between wild oat plants and wheat plants.
(3 marks)
Hint
Are the two plants the same species? What does a taller plant take from a shorter one? What do plants use the nutrients from the soil to make?
Mark Scheme
- Interspecific competition (1 mark)
- The wild oats shade the wheat, so the wheat gets less light and carries out less photosynthesis (1 mark)
- Less nitrate for the wheat to make amino acids (proteins, DNA or ATP), or less phosphate to make DNA (ATP or phospholipids) (1 mark)
Also accepted / rejected
Also accepted
- Any named organic molecule that contains nitrogen or phosphorus (point 3)
Tips
- Name the competition, interspecific (between different species), not intraspecific
- Link less light to less photosynthesis, not just “less growth”
- Link mineral ions to what they make, such as less nitrate for amino acids, proteins or DNA; less phosphate for DNA, ATP or phospholipids
A weed is a plant growing where it is not wanted. Ragwort is a weed which grows in some fields used for grazing horses.
Describe how you could estimate the number of ragwort plants in a field.
(5 marks)
Hint
How will you place the quadrats so the sample isn’t biased? What do you count, how many quadrats do you need, and how do you get from the quadrats to the whole field?
Mark Scheme
- Use a grid (e.g. two tape measures at right angles) to divide the field into squares (1 mark)
- Use random numbers (e.g. from a random number generator) to choose the coordinates of each quadrat (1 mark)
- Count the number of ragwort plants in each quadrat (1 mark)
- Use a large number of quadrats (10 or more) and calculate the mean number per quadrat (1 mark)
- Multiply the mean by the number of quadrats that would fit in the field (area of field ÷ area of quadrat) (1 mark)
Also accepted / rejected
Also accepted
- A belt transect with quadrats at regular intervals (points 1 and 2)
- Mean number per m² × area of the field in m² (point 5)
Not accepted
- “Scale up” without saying how (point 5)
Tips
- Use a grid and random coordinates (e.g. a random number generator); don’t “throw quadrats”
- Count the number of ragwort plants in each quadrat, in a large sample (10 or more), and calculate the mean
- Explain how to get the total (area of field ÷ area of quadrat × mean number per quadrat). “Scale up” on its own isn’t enough
What earns marks
- A grid and random coordinates are well known
Ecologists investigated the population size of a species of ground beetle using the mark-release-recapture method.
Table 1 shows the ecologists’ results.
Table 1
| Number of beetles | |
|---|---|
| Caught and marked in the first sample | 320 |
| Marked beetles in the second sample | 90 |
| Unmarked beetles in the second sample | 270 |
Use the data provided in Table 1 to estimate the population size of the ground beetle.
Show your working.
Answer = ________ beetles
(2 marks)
Hint
The second sample is the marked plus the unmarked beetles. Population = number marked in first sample × total in second sample ÷ number marked in second sample.
Mark Scheme
1280 beetles (2 marks)
Working:
- Total in the second sample: 90 + 270 = 360
- Population = 320 × 360 ÷ 90 = 1280
If the answer is wrong, 1 mark for any of:
- 960 (used only the 270 unmarked beetles as the second sample)
- 427 (divided by the unmarked beetles instead of the marked beetles)
Tips
- The total in the second sample is the marked plus the unmarked beetles (90 + 270 = 360). Using only 270 gives 960
- Divide by the number of marked beetles recaptured (90), not by the unmarked beetles
Microbiologists investigated the effect of two temperatures on the population growth of a species of bacterium.
They grew separate bacterial cultures in identical nutrient media at 25 °C and 30 °C for 6 hours.
Figure 1 shows the estimated final population size of each culture as a log₁₀ value.
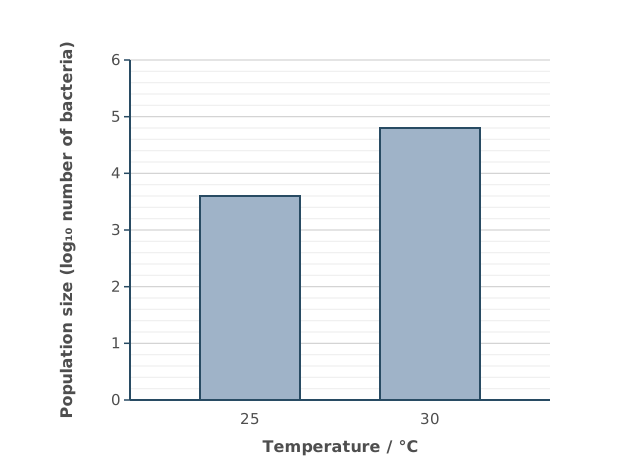
The bacterial population at 30 °C is larger than that at 25 °C.
Calculate this difference as a percentage increase.
The actual number of bacteria can be calculated from the log₁₀ value by using the 10ˣ button on your calculator.
Give your answer to the nearest whole number.
Show your working.
Answer = ________ %
(2 marks)
Hint
Read the log value for each temperature from Figure 1. Convert each one into an actual number using the 10ˣ button, then percentage increase = (new − original) ÷ original × 100.
Mark Scheme
1485% (2 marks)
Working:
- Read from Figure 1: 3.6 at 25 °C and 4.8 at 30 °C
- 25 °C: 103.6 = 3981 bacteria
- 30 °C: 104.8 = 63 096 bacteria
- Increase: 63 096 − 3981 = 59 115
- Percentage increase: 59 115 ÷ 3981 × 100 = 1484.9, so 1485%
If the answer is wrong, 1 mark for any of:
- 1484.9 (not rounded to the nearest whole number)
- 1585 (63 096 ÷ 3981 × 100, so the original 100% wasn’t taken away)
- 14.8 (not multiplied by 100)
Tips
- Read the bars against the axis carefully. The gridlines are every 0.2
- Convert the log values first, using the 10ˣ button (not the log button). 103.6 and 104.8
- Don’t find the percentage increase of the log values themselves, which gives the wrong answer of 33
- Percentage increase = increase ÷ original × 100, rounded to the nearest whole number
In a species of mouse, a gene for fur colour has a dominant allele for black fur, B, and a recessive allele for brown fur, b.
A population of these mice contained 64% black mice.
Use the Hardy–Weinberg equation to calculate the percentage of mice heterozygous for gene B.
Show your working.
Answer = ________ %
(2 marks)
Hint
What does 2pq represent in Hardy–Weinberg? Make sure you’re using the correct values for p and q from the data given.
Mark Scheme
Walkthrough
Step 1: find q². Black is the dominant phenotype, so the 64% black mice include both BB and Bb. You can only be sure of the genotype of the brown mice (bb), so start with them. 100% − 64% = 36%, so q² = 0.36.
Step 2: find q and p. q = √0.36 = 0.6, and p = 1 − 0.6 = 0.4.
Step 3: find the heterozygotes. Heterozygous = 2pq = 2 × 0.4 × 0.6 = 0.48, so 48%.
Mark scheme
48% (2 marks)
If the answer is wrong, 1 mark for any of:
- 0.48 (not given as a percentage)
- showing that 2pq gives the heterozygotes, or that heterozygotes = 1 − (p² + q²)
Also accepted / rejected
Also accepted
- 2 × two different numbers, as evidence of using 2pq (1 mark)
Tips
- Black is dominant, so q² = 0.36 (brown), q = 0.6 and p = 0.4
- Heterozygotes = 2pq = 2 × 0.4 × 0.6 = 0.48, so 48%; don’t divide 2pq by 2
- Write the equation correctly as p² + 2pq + q² = 1, not 2pq²
The MN blood group in humans is controlled by a gene with two codominant alleles, M and N. There are three MN phenotypes, M, MN and N.
Scientists determined the frequencies of the MN alleles and MN phenotypes in a large population. They then used a statistical test to determine if the frequencies of the three phenotypes differed significantly from the frequencies expected according to the Hardy–Weinberg equation.
The scientists concluded that the observed frequencies of the three phenotypes differed significantly from the expected frequencies.
Use your knowledge of the Hardy–Weinberg principle to suggest two reasons why.
(2 marks)
Hint
Which conditions must be true for the Hardy–Weinberg principle to apply? Which could fail in a real human population?
Mark Scheme
Max 2 marks
- Selection for or against a blood group (1 mark)
- Mutation (1 mark)
- Migration (immigration or emigration) (1 mark)
- Non-random mating (1 mark)
Explanation (not marked): The Hardy–Weinberg principle only works if there is no selection, mutation or migration and mating is random. The population is large, so one of these other conditions must not have been met.
Also accepted / rejected
Also accepted
- “The population is not isolated” (point 3)
Not accepted
- The opposite, e.g. “no selection” (points 1 to 4)
Tips
- Give conditions that break Hardy–Weinberg, such as selection, mutation, migration or non-random mating
- Phrase them as happening (e.g. “there was migration”), not the opposite
- The stem says the population is large, and crossing over, codominance or independent segregation aren’t reasons
The TP53 gene codes for a tumour suppressor protein called p53. Mutations in TP53 are found in about half of all human cancers.
Explain how a mutation in TP53 can lead to cancer.
(3 marks)
Hint
What changes in the DNA? What happens to the protein it codes for? What does a tumour suppressor protein normally do?
Mark Scheme
- A change in the base sequence of the DNA (1 mark)
- So the amino acid sequence of p53 changes, and its tertiary structure changes (1 mark)
- So p53 no longer slows cell division, and the cells divide rapidly and uncontrollably (1 mark)
Explanation (not marked): Normally, p53 slows the cell cycle when DNA is damaged, or makes damaged cells die. If p53 doesn’t work, cells with damaged DNA keep dividing.
Also accepted / rejected
Also accepted
- “Cell division can’t be regulated” (point 3)
Not accepted
- “Different amino acids are formed” (point 2)
Tips
- A mutation is a change in the DNA base sequence. It isn’t a change in RNA, or the same as methylation
- This changes the amino acid sequence, so the tumour suppressor protein’s tertiary structure changes
- So cell division becomes rapid and uncontrolled. Say “cell division”, not “growth”
The HER2 gene codes for a receptor protein in the cell-surface membrane. When a growth factor binds to this receptor, the receptor sends signals into the cell that stimulate cell division. In some breast cancers, a change in the HER2 gene has turned it into an oncogene.
Suggest and explain how a change in the HER2 gene can cause a tumour to develop.
(3 marks)
Hint
What exactly changes in the gene? What happens to the protein it codes for? How would that affect the signals to divide?
Mark Scheme
- A mutation in the HER2 gene changes its base sequence (1 mark)
- So the receptor protein has a different shape and sends signals even when no growth factor is bound, or more receptor protein is made, so more signals are sent (1 mark)
- So the cells divide rapidly and uncontrollably (by mitosis), forming a tumour (1 mark)
Explanation (not marked): Normally, the receptor only sends signals when a growth factor binds to it, so cell division is controlled. An oncogene keeps the signals coming.
Also accepted / rejected
Also accepted
- A named mutation, e.g. substitution or duplication (point 1)
- A change in the amino acid sequence of the receptor (point 2)
- “Mitosis can’t be controlled” (point 3)
Not accepted
- No receptor protein is made, or the protein is non-functional (point 2)
- “Meiosis” (point 3)
Tips
- Say it’s a mutation, a change in the base sequence of the gene, not an epigenetic change
- The receptor protein is changed, or more is made. Don’t say no protein or a non-functional protein is made
- This causes rapid, uncontrolled cell division (mitosis), which forms a tumour
- The amino acid sequence changes in the protein, not in the gene
Doctors can use DNA probes to screen people for the allele that causes sickle cell disease.
Describe what a DNA probe is.
(2 marks)
Hint
How many strands does a probe have? How does it find the allele it’s looking for?
Mark Scheme
- A short, single-stranded piece of DNA (1 mark)
- Its bases are complementary to the allele being tested for (1 mark)
Also accepted / rejected
Also accepted
- “A complementary base sequence” (point 2)
Not accepted
- “A fragment of DNA” without saying single-stranded (point 1)
Tips
- Say it’s short and single-stranded; “a fragment of DNA” isn’t enough
- Say its bases are complementary to the target allele
- Define the probe; don’t describe how it’s labelled or used
Duchenne muscular dystrophy can be caused by mutations in the DMD gene, which codes for the protein dystrophin. Dystrophin is not an enzyme. In some people, the mutation is an inversion.
Explain how an inversion mutation can lead to the production of non-functional dystrophin.
(4 marks)
Hint
What exactly is reversed in an inversion? Follow the effect from the DNA to the amino acids, then to the bonds and the shape of the protein.
Mark Scheme
- The sequence of DNA bases is reversed (inverted) (1 mark)
- So the sequence of amino acids (primary structure) changes (1 mark)
- So hydrogen, ionic or disulfide bonds form in different places (1 mark)
- So the tertiary structure changes (1 mark)
Also accepted / rejected
Also accepted
- Nucleotides for bases (point 1)
- A shorter amino acid sequence (point 2)
Not accepted
- Amino acids being “formed” or “produced” (point 2)
- An active site changing shape (point 4, as dystrophin is not an enzyme)
Tips
- Say it’s the DNA base sequence that is inverted
- Then the amino acid sequence changes, so bonds form in different places and the tertiary structure changes
- Dystrophin isn’t an enzyme, so don’t mention an active site
In a study of a mouse embryo, 2.0 × 10⁻⁷ % of the genome of one cell had changed because of mutations.
You can assume that:
- the mouse genome contains 2.7 × 10⁹ nucleotides
- on average, 0.9 mutations happen in each cell cycle
- each cell cycle lasts 24 hours.
Calculate the age of the embryo in days.
Show your working.
Answer = ________ days
(2 marks)
Hint
Turn the percentage into a number of mutated nucleotides. How many cell cycles would produce that many mutations?
Mark Scheme
6 days (2 marks)
Working:
- Number of mutations: (2.0 × 10⁻⁷ ÷ 100) × 2.7 × 10⁹ = 5.4
- Number of cell cycles: 5.4 ÷ 0.9 = 6
- Each cycle is 24 hours, so 6 cycles = 6 days
If the answer is wrong, 1 mark for any of:
- 600 or another power of ten (not dividing the percentage by 100)
- 144 (multiplying by 24)
- 4.86 (multiplying by 0.9 instead of dividing)
- 5.4 (not dividing by 0.9)
Tips
- Divide the percentage by 100 before using it
- Divide the number of mutations by the mutations per cycle to get the number of cycles
- Each cycle is one day, so don’t multiply by 24
EcoRI and PstI are restriction endonucleases. Figure 1 shows where each enzyme cuts a linear DNA molecule that is 12 kb long (1 kb = 1000 base pairs).
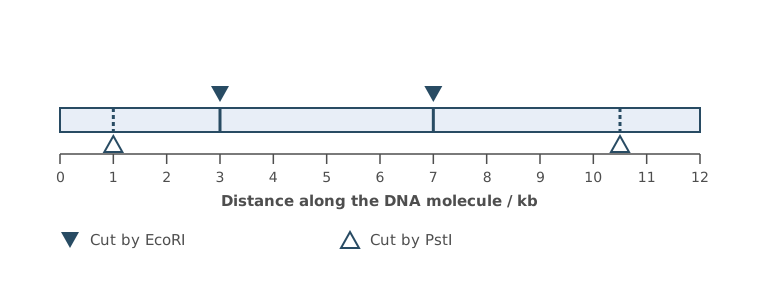
Scientists cut many copies of this DNA molecule completely in two experiments, then separated the fragments by gel electrophoresis.
- Experiment 1. The DNA was cut with EcoRI only.
- Experiment 2. The DNA was cut with EcoRI and PstI.
Complete Figure 2 to show the relative positions of the bands in experiments 1 and 2.
(2 marks)
Hint
How many cuts are there in each experiment, and how many fragments does that give for a linear molecule? Which fragment is not cut by PstI? Which fragments travel furthest?
Mark Scheme
Experiment 1 with 3 bands and experiment 2 with 5 bands, all in the correct relative positions = 2 marks
Experiment 1 with 3 bands and experiment 2 with 5 bands, but not in the correct positions = 1 mark
For 2 marks, the 4 kb band must be at the same height in both lanes.
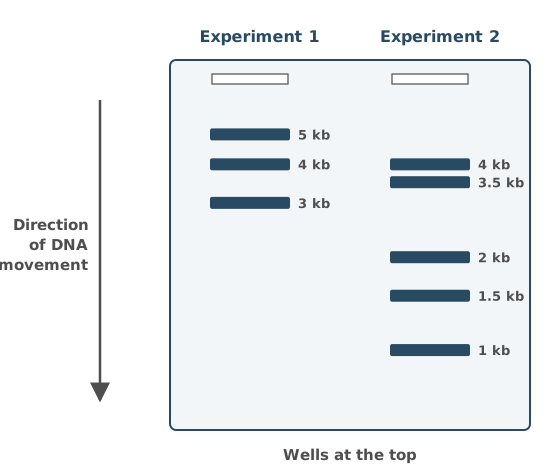
Explanation (not marked): EcoRI cuts at 3 kb and 7 kb, giving fragments of 3, 4 and 5 kb. PstI also cuts the 3 kb fragment into 1 and 2 kb, and the 5 kb fragment into 3.5 and 1.5 kb. The 4 kb fragment isn’t cut by PstI, so it is in both lanes. Shorter fragments travel further through the gel.
Tips
- Count the cuts. A linear molecule gives one more fragment than the number of cuts, so experiment 1 gives 3 bands and experiment 2 gives 5
- Draw horizontal bands, with the shortest fragments furthest from the wells
- A fragment that isn’t cut by the second enzyme must be at the same height in both lanes
Scientists cut a DNA molecule with restriction enzymes and separated the fragments by gel electrophoresis.
Suggest how they could find the size of each DNA fragment.
(2 marks)
Hint
How could you tell the size of a band if you had something to compare it with on the same gel?
Mark Scheme
- Run DNA fragments of known sizes (a DNA ladder) on the same gel (1 mark)
- Compare the positions of their bands with the bands of the unknown fragments (1 mark)
Tips
- Answer the question. Run fragments of known sizes (a ladder) alongside the samples, then compare the band positions
- Describing how electrophoresis separates fragments doesn’t answer it
Two restriction enzymes cut a linear DNA molecule at four sites in total.
How many fragments would be produced if the DNA molecule was a plasmid with the same four sites?
(1 mark)
Hint
What shape is a plasmid? How many pieces do you get if you cut a ring in four places?
Mark Scheme
4 (1 mark)
Explanation (not marked): A plasmid is a circle of DNA, so four cuts give four fragments. A linear molecule gives one more fragment than the number of cuts.
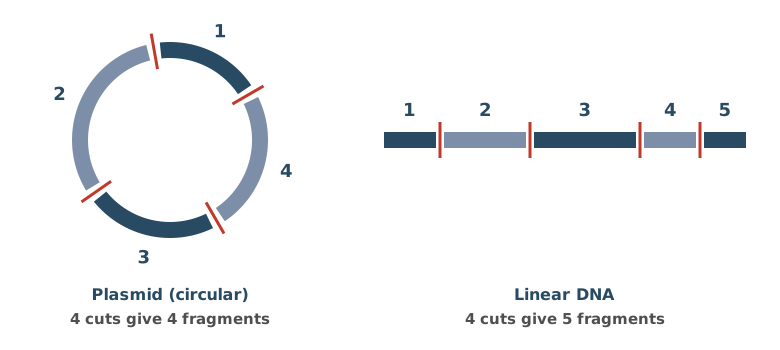
Tips
- A plasmid is circular, so the number of fragments equals the number of cuts. A linear molecule gives one more
Short tandem repeats (STRs) are short base sequences, usually 2 to 7 base pairs long, that are repeated one after another. For example, the STR called TH01 is the sequence TCAT, repeated between 3 and 14 times. People differ in the number of repeats, so STRs are used in genetic fingerprinting.
Describe how a section of DNA containing an STR could be cut out of a sample of DNA.
(2 marks)
Hint
Which enzymes cut DNA? Where exactly do they cut?
Mark Scheme
- Use restriction endonucleases (restriction enzymes) (1 mark)
- They cut the DNA at specific base sequences (recognition sites) on either side of the STR (1 mark)
Also accepted / rejected
Also accepted
- “Palindromic sequences” (point 2)
Tips
- Name restriction endonucleases (restriction enzymes), not ligase, helicase, reverse transcriptase or DNA polymerase
- They cut at specific base sequences (recognition sites). “At a specific site” isn’t enough
In families where many people have had cancer, relatives can be tested for harmful mutations in the TP53 gene, using DNA from a cheek swab.
Describe how the DNA could be screened for known harmful mutations in the TP53 gene.
(4 marks)
Hint
How do you get enough DNA? How is it cut and separated? What binds to a mutated sequence, and how would you see it?
Mark Scheme
Max 4 marks
- Amplify the DNA using PCR (1 mark)
- Cut it with restriction endonucleases (1 mark)
- Separate the fragments by gel electrophoresis (1 mark)
- Add labelled DNA probes, which bind (hybridise) to the mutated sequences (1 mark)
- Find the bound probes by fluorescence (or radioactivity), or compare the bands with DNA known to have the mutations (1 mark)
Explanation (not marked): Each technique has a different function. PCR makes enough copies of the DNA. Restriction endonucleases cut it into fragments, and electrophoresis separates the fragments by size. Electrophoresis can’t show a mutation on its own, because it only sorts fragments by length. The labelled probe finds the mutation, because it only binds to the complementary mutated sequence, so it shows which fragment carries the mutation. You see it by its label, for example fluorescence under UV light. Some methods skip the cutting and electrophoresis, but for 4 marks give every step.
Also accepted / rejected
Also accepted
- Using a microarray (point 3)
- Instead of points 2 to 5, sequencing the amplified DNA and comparing it with the known mutation sequences (max 3 marks altogether)
Tips
- Amplify the DNA by PCR, cut it with restriction endonucleases, and separate the fragments by electrophoresis
- Add labelled DNA probes, which bind to the mutations. Say “bind”, not just “complementary”
- Find the bound probes by fluorescence or radioactivity
- Don’t mix up probes with primers
The genome of the bacterium Mycobacterium tuberculosis is about 4.4 million base pairs long and contains about 4000 genes.
Working out the proteome of M. tuberculosis from its genome is easier than for a eukaryote.
Explain why.
(2 marks)
Hint
What does a eukaryotic gene contain that doesn’t code for amino acids? What other kind of gene do eukaryotes have more of?
Mark Scheme
- Bacteria have no introns (non-coding DNA), but eukaryotic genes do (1 mark)
- Eukaryotes have more regulatory genes (1 mark)
Explanation (not marked): Regulatory genes control when, and in which cells, other genes are switched on. So a gene in the genome may not be expressed, which makes it hard to predict the proteome from the genome.
Also accepted / rejected
Not accepted
- “Bacterial DNA is shorter” or “has fewer genes” (no mark)
Tips
- Eukaryotic genomes contain introns (non-coding DNA) and more regulatory genes, so it’s harder to tell which proteins they make
- “Shorter DNA” or “fewer genes” doesn’t explain it
Scientists worked out the proteome of Neisseria meningitidis, a bacterium that causes meningitis. This helped them to protect people against the disease.
Explain how.
(2 marks)
Hint
Which of the bacterium’s proteins would the immune system recognise? What could scientists make from them?
Mark Scheme
- It identifies the bacterium’s antigens (1 mark)
Explanation (not marked): The proteome is every protein the bacterium makes. Scientists can use it to find proteins that the immune system would recognise as foreign. These are antigens. - These are used to make a vaccine (or antibodies) (1 mark)
Explanation (not marked): A vaccine containing these antigens makes the body produce memory cells, so a person is protected before they meet the real bacterium.
Also accepted / rejected
Also accepted
- A description of active immunity from the vaccine (point 2)
Tips
- Use the word antigens. The proteome shows which proteins could act as antigens
- Be specific. They are used to make a vaccine, not just “medicines”
- Antibiotics aren’t relevant here
Scientists compared the mitochondrial genes of cichlid fish from one crater lake. The comparison showed that the open-water fish formed a distinct genetic group, although all the fish were the same species.
Explain how the scientists could use the mitochondrial genes to show that the open-water fish are a separate genetic group from the other fish in the lake.
Include how modern techniques make it possible to compare the genes quickly.
(3 marks)
Hint
What exactly would you compare in the genes? How would the DNA of a distinct group differ? Which technique makes lots of copies of DNA quickly, or reads it automatically?
Mark Scheme
- Compare the DNA base sequences (or the banding patterns of DNA fragments) (1 mark)
- A distinct group has different alleles (base sequences) from the other fish (1 mark)
- PCR quickly amplifies the DNA, or DNA sequencing is automated, or electrophoresis separates the fragments, or DNA probes identify the alleles (1 mark)
Also accepted / rejected
Also accepted
- “Not closely related” for a distinct group (point 2)
Not accepted
- “Different genes” (point 2, as the same species has the same genes)
- “A different species” for a distinct group (point 2)
Tips
- Compare the DNA base sequences of the mitochondrial genes, not mRNA or amino acid sequences
- The fish are the same species, so they have the same genes but different alleles (base sequences)
- Name a technique and say how it speeds things up. For example, PCR rapidly amplifies the DNA, or sequencing is automated
What earns marks
- PCR amplifying DNA quickly is the point most often credited
One DNA molecule containing a 16 base pair STR (TCAT repeated 4 times) was copied by PCR for 30 cycles.
Assume that the number of molecules doubles in every cycle.
Calculate the total number of base pairs in all the copies of the STR after 30 cycles.
Show your working.
Answer = ________ base pairs
(2 marks)
Hint
How many molecules are there after 1 cycle, 2 cycles and 3 cycles? Write that as a power of 2, then multiply by the base pairs in one molecule.
Mark Scheme
1.72 × 10¹⁰ base pairs (2 marks)
Working:
- Each cycle doubles the number of molecules, so after 30 cycles there are 2³⁰ = 1 073 741 824 molecules
- Each molecule has 16 base pairs, so 16 × 1 073 741 824 = 17 179 869 184 = 1.72 × 10¹⁰ base pairs
If the answer is wrong, 1 mark for:
- showing 2³⁰ (or 1.07 × 10⁹)
Also accepted / rejected
Also accepted
- 1.7 × 10¹⁰
Tips
- Each cycle doubles the number of molecules, so 30 cycles gives 2³⁰ molecules
- Multiply by the 16 base pairs in each molecule
- Don’t use 16 × 30, 30² or 2 × 30
Short tandem repeats (STRs) are short base sequences, usually 2 to 7 base pairs long, that are repeated one after another. For example, the STR called TH01 is the sequence TCAT, repeated between 3 and 14 times. People differ in the number of repeats, so STRs are used in genetic fingerprinting.
Before genetic fingerprinting, each STR is copied many times by the polymerase chain reaction (PCR). To do this, scientists need to know the short base sequences on either side of the STR.
Explain why these base sequences need to be known.
(2 marks)
Hint
What has to bind to each DNA strand before copying can begin? How does it find the right place?
Mark Scheme
- To make primers (1 mark)
- The primers have a complementary base sequence, so they bind on either side of the STR and give DNA polymerase a place to start (1 mark)
Also accepted / rejected
Also accepted
- Taq polymerase for DNA polymerase (point 2)
- “Primers stop the separated strands joining back together” (point 2)
Tips
- Keep to PCR. The known sequences are needed to make primers
- Say the primers have a complementary base sequence (not just “are complementary”), or give a starting point for DNA polymerase
- Restriction enzymes, probes and start codons aren’t relevant here
Some cancers are caused by epigenetic changes to genes, rather than by mutations. Scientists are developing drugs that could reverse these changes.
Suggest and explain how these drugs could work.
(3 marks)
Hint
Which two types of gene are involved in cancer? How does methylation of DNA affect transcription? How does acetylation of histones affect it?
Mark Scheme
Max 3 marks
Which genes
- Drugs could decrease methylation of tumour suppressor genes (1 mark)
- Drugs could increase methylation of oncogenes (1 mark)
How it works
- Methylation of DNA inhibits transcription, so less methylation lets the gene be transcribed (1 mark)
- Acetylation of histones increases transcription, or less acetylation inhibits it (1 mark)
Also accepted / rejected
Also accepted
- “Methylation of the promoter” for methylation of DNA (point 3)
- “Expression” for transcription (points 3 and 4)
Tips
- Suggest drugs that decrease methylation of tumour suppressor genes, or increase methylation of oncogenes
- Explain the effect. Methylation of DNA inhibits transcription, and acetylation of histones increases it
- Say “transcription” or “expression”, not genes “switched on” or “off”. Epigenetic changes aren’t mutations
Some prostate cancers grow in response to the hormone testosterone. Testosterone binds to a receptor inside the cancer cells, which stimulates cell division. Some drugs used to treat these cancers have a similar shape to testosterone.
Suggest and explain how these drugs slow the growth of the cancer.
(3 marks)
Hint
Where could a drug with a similar shape to testosterone bind? What would that stop? Once testosterone binds, what does the receptor normally do in the nucleus?
Mark Scheme
- The drug binds to the testosterone receptor (1 mark)
- So testosterone can’t bind (1 mark)
- So the receptor doesn’t bind to the promoter as a transcription factor, or RNA polymerase isn’t activated (1 mark)
Explanation (not marked): The genes that stimulate cell division are transcribed less, so the cancer cells divide more slowly.
Also accepted / rejected
Not accepted
- “Active site” or “enzyme–substrate complex” (points 1 and 2)
- The drug binding to testosterone itself (point 1)
Tips
- The drug binds to the receptor, so testosterone can’t bind. The drug doesn’t bind to testosterone itself
- So the transcription factor doesn’t bind to the promoter, and RNA polymerase isn’t activated
- It’s a receptor, so don’t use “active site” or “enzyme–substrate complex”
In the ileum, bile salts emulsify lipids and are involved in forming micelles.
Explain how emulsification and the formation of micelles help the digestion and absorption of lipids.
(4 marks)
Hint
There are two roles to explain. Think about what emulsification does to the size of lipid droplets and why that helps lipase, then how micelles get the products of digestion to the epithelial cells.
Mark Scheme
Emulsification
- Bile salts break the lipids into small droplets, which increase the surface area (1 mark)
- So there is faster hydrolysis by lipase (1 mark)
Micelles
- Micelles carry fatty acids and monoglycerides to the cell-surface membrane of the cells lining the ileum (1 mark)
- So the fatty acids and monoglycerides diffuse into the cells (1 mark)
Also accepted / rejected
Also accepted
- Micelles make fatty acids and monoglycerides more soluble, or keep their concentration high next to the membrane (point 3)
- “Lining of the ileum” or “epithelium” instead of “cell”
Tips
- Don’t stop at “increases surface area”. Add that this speeds up hydrolysis by lipase
- Emulsification doesn’t hydrolyse lipids itself; it breaks them into smaller droplets, giving a larger surface area so lipase hydrolyses them faster
- Keep the two roles separate. Emulsification helps digestion, and micelles help absorption
- Say micelles carry fatty acids and monoglycerides to the cells lining the ileum, not just into the lumen
- Name the molecules (fatty acids/monoglycerides) and say they diffuse into the cells; “fatty acids are absorbed” isn’t enough
Pre-mRNA is modified to produce mRNA.
Describe how.
(1 mark)
Hint
Pre-mRNA contains both coding and non-coding sections. Which sections are removed?
Mark Scheme
- The introns are removed (and the exons are joined together) (1 mark)
Also accepted / rejected
Also accepted
- Describing the introns as the non-coding sections
Not accepted
- “The pre-mRNA is spliced” on its own, without saying what is removed
Tips
- Don’t just write “pre-mRNA is spliced”. Say the introns are removed (and the exons joined)
Figure 1 shows the energy contained in molecules during an enzyme-controlled reaction.
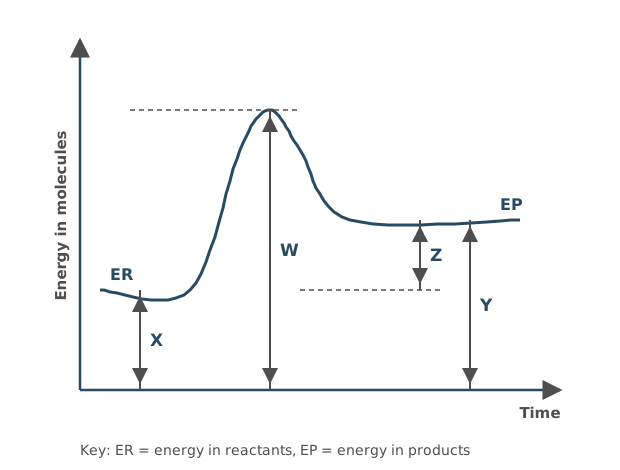
Which expression represents the activation energy (Ea) of this reaction?
Tick (✓) one box.
Hint
Activation energy is the energy needed to start the reaction. Find the difference between the energy of the reactants and the peak of the curve.
Mark Scheme
B) W − X (1 mark)
Activation energy is measured from the energy of the reactants (top of X) up to the peak of the curve (top of W).
Tips
- Measure activation energy from the energy of the reactants (ER) up to the peak of the curve, which is W − X. W − Y measures from the products instead
Complete Table 1 by adding a tick (✓) if the feature is present in the biological molecule.
Table 1
| Feature | Lactose | Starch | RNA |
|---|---|---|---|
| Contains glucose | |||
| Contains galactose | |||
| Contains fructose | |||
| Contains phosphate | |||
| Formed by condensation reaction(s) | |||
| Is a polymer |
(3 marks)
Hint
For each molecule, think about which monomers it is made from and whether it is made of many repeating units.
Mark Scheme
1 mark for each correct column (3 marks)
| Feature | Lactose | Starch | RNA |
|---|---|---|---|
| Contains glucose | ✓ | ✓ | |
| Contains galactose | ✓ | ||
| Contains fructose | |||
| Contains phosphate | ✓ | ||
| Formed by condensation reaction(s) | ✓ | ✓ | ✓ |
| Is a polymer | ✓ | ✓ |
Tips
- Lactose is a disaccharide of glucose and galactose, so it isn’t a polymer
- Starch is a polymer made only of α-glucose
- RNA nucleotides contain ribose (a pentose sugar), not glucose, plus a phosphate group and a base
- All three are formed by condensation reactions
Maltase catalyses the hydrolysis of maltose into glucose.
A student investigated the effect of a drug called acarbose on maltase activity.
The student used the following method.
- Mix together (in tube X) solutions of maltose, acarbose and maltase in a 14 : 3 : 2 volume ratio so that the total volume is 80 cm³
- Leave the mixture at 37 °C for 10 minutes.
- Measure the glucose concentration in the mixture.
- Repeat steps 1 to 3 with two different mixtures.
Calculate the volume of acarbose solution used in tube X.
Volume of acarbose = ________ cm³
(1 mark)
Hint
Add up all the parts of the ratio first, then work out what fraction of the total volume is acarbose.
Mark Scheme
12.6 cm³ (1 mark)
Working:
- Total parts: 14 + 3 + 2 = 19
- One part: 80 ÷ 19 = 4.21
- Three parts: 4.21 × 3 = 12.6
Also accepted / rejected
Also accepted
- 13, or any value that rounds to 12.6
Tips
- Add all the parts of the ratio (14 + 3 + 2 = 19)
- Don’t round partway through; work out 80 ÷ 19 × 3 in one go
Maltase catalyses the hydrolysis of maltose into glucose.
A student made three mixtures and measured the glucose concentration in each one over 10 minutes. Figure 1 shows the results.
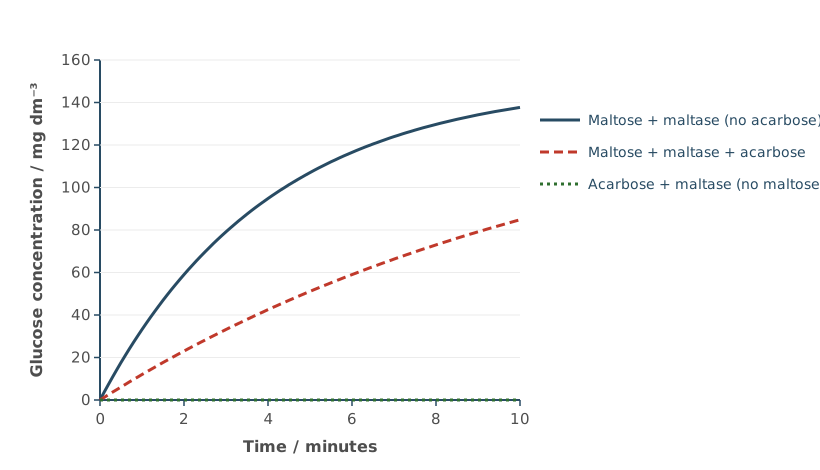
Acarbose is a competitive inhibitor of maltase.
Use this information and your knowledge of enzymes to explain the results for each mixture.
(4 marks)
Hint
Compare the three lines. What does a competitive inhibitor compete with, and where does it bind? Why is there no glucose at all in one mixture?
Mark Scheme
Maltose + maltase + acarbose
- Acarbose binds to the active site of maltase (1 mark)
- So it slows down the hydrolysis of maltose, and less glucose is made (1 mark)
Maltose + maltase (no acarbose)
- With no acarbose (no inhibitor), more maltose is hydrolysed, so more glucose is produced (1 mark)
Acarbose + maltase
- There is no maltose (no substrate), so no glucose is made; acarbose is not a substrate of maltase (1 mark)
Also accepted / rejected
Also accepted
- “Digested” or “broken down” instead of “hydrolysed”
Not accepted
- Saying acarbose stops the hydrolysis (glucose is still made when acarbose is there)
Tips
- With acarbose, say it binds to the active site; “a binding site” or “an allosteric site” doesn’t get the mark
- Say acarbose slows (reduces) the hydrolysis of maltose, not that it stops it, because glucose is still made
- The question says the inhibitor is competitive, so don’t describe non-competitive inhibition. Acarbose binds to the active site of maltase, not to maltose
- For the mixture with no acarbose, link more maltose being hydrolysed to more glucose being produced
Maltase catalyses the hydrolysis of maltose into glucose. A student mixed maltose, maltase and a drug called acarbose, and measured how much glucose was produced in 10 minutes.
Give:
- one change the student could make to confirm that acarbose is a competitive inhibitor
- the result you would expect.
(2 marks)
Hint
A competitive inhibitor competes with the substrate for the active site. What could you change so that the substrate wins more often, and what would you then see?
Mark Scheme
- Increase the concentration of maltose (the substrate) (1 mark)
- Expect more glucose to be produced, or a faster rate of reaction (1 mark)
Tips
- Increase the substrate (maltose) concentration and say you would expect more glucose to form, because more maltose outcompetes acarbose for the active site. With a non-competitive inhibitor, adding more substrate would not reduce the inhibition
- Changing the acarbose concentration only changes how much inhibition there is, not which type it is
In a leaf, sucrose is moved into companion cells before it enters the phloem.
Figure 1 shows part of the cell-surface membrane of a companion cell in a leaf.
- Carrier protein X is linked to an ATP hydrolase enzyme.
- Carrier protein Y co-transports H⁺ ions and sucrose molecules in the same direction.
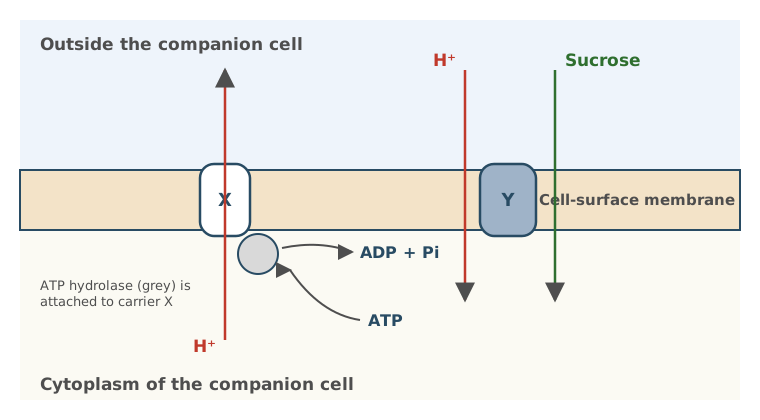
Use Figure 1 and the information above to explain how sucrose is moved into the companion cell, and why water then enters the cell.
Your answer should refer to the role of:
- ATP hydrolase
- carrier protein X and carrier protein Y.
(4 marks)
Hint
Follow the H⁺ ions. How do they get out of the cell, and what happens as they move back in through Y? Then think about what the extra sucrose does to the water potential of the cell.
Mark Scheme
- ATP hydrolysis releases energy (1 mark)
- Which X uses for the active transport of H⁺ out of the companion cell (1 mark)
- H⁺ moves back in through Y, causing the co-transport of sucrose into the companion cell (1 mark)
- This lowers the water potential of the companion cell, so water moves in by osmosis (1 mark)
Also accepted / rejected
Also accepted
- “More negative water potential” (point 4)
Not accepted
- Saying energy is made, produced or created (point 1)
- “Hydrogen” instead of H⁺ or hydrogen ions
Tips
- Say ATP hydrolysis releases energy; never say energy is “produced”, “made” or “created”
- Write H⁺ (hydrogen ions), not “hydrogen”
- Give the direction of every movement, for example H⁺ is actively transported out of the cell by X
- Sucrose enters by co-transport through Y as H⁺ moves back in down its concentration gradient; don’t say sucrose is actively transported or enters by facilitated diffusion
- Explain the water movement using water potential. More sucrose lowers the water potential of the cell, so water enters by osmosis
Figure 1 shows part of the cell-surface membrane of a companion cell in a leaf.
- Carrier protein X is linked to an ATP hydrolase enzyme.
- Carrier protein Y co-transports H⁺ ions and sucrose molecules in the same direction.
A respiratory inhibitor caused a change in the pH of the solution outside the companion cell.
Use information in Figure 1 to explain how.
(3 marks)
Hint
What does a respiratory inhibitor stop the cell producing? Follow what that means for ATP hydrolase and carrier protein X, then link the H⁺ concentration outside the cell to pH.
Mark Scheme
- Less ATP is produced (1 mark)
- So less ATP is hydrolysed and less energy is released for carrier protein X (1 mark)
- So fewer H⁺ are pumped out of the cell (while H⁺ still move in through Y), and the pH outside the cell increases (1 mark)
Also accepted / rejected
Also accepted
- “Less acidic”, or a sensible change in pH value, e.g. from pH 5 to pH 6 (point 3)
Not accepted
- “No energy is produced” (point 2)
Tips
- Start with the first link. The respiratory inhibitor means less ATP is produced
- Then say less ATP is hydrolysed, so less energy is released for carrier protein X. Say “less energy released”, not “no energy produced”
- Link H⁺ to pH. Fewer H⁺ are pumped out of the cell (while H⁺ still move in through Y), so the pH outside increases
- Use Figure 1; you don’t need details of respiration such as chemiosmosis
In companion cells, carrier protein X actively transports H⁺ ions out of the cell. Carrier protein Y co-transports H⁺ ions and sucrose molecules into the cell.
Explain how a change in the expression of the genes coding for these carrier proteins could increase the rate at which sucrose is loaded into companion cells.
(2 marks)
Hint
What does increased expression of a gene produce more of? How would more of carrier proteins X and Y affect the movement of H⁺ and sucrose?
Mark Scheme
- More expression of the genes produces more carrier proteins X and Y (1 mark)
- So there is faster active transport of H⁺ out of the cell and faster co-transport of sucrose into it (1 mark)
Also accepted / rejected
Not accepted
- Sucrose moving out of the companion cell
Tips
- Treat the change in gene expression as more of the genes being expressed, so more carrier proteins X and Y are made; it is not a mutation
- Don’t describe changes to the tertiary structure of the carrier proteins
- Link more carrier proteins to faster transport, with more H⁺ actively transported out, or more sucrose co-transported in
Octopus blood contains the respiratory pigment haemocyanin.
Figure 1 shows the dissociation curve for oxyhaemocyanin in a species of octopus at two temperatures.
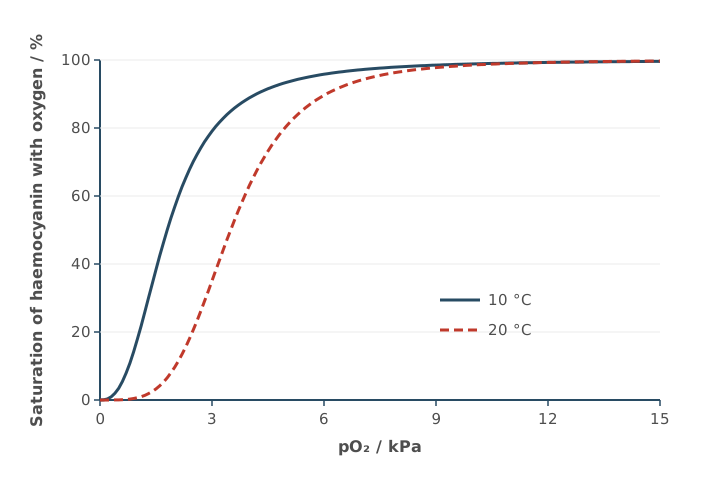
Octopuses use gills for gas exchange.
Using Figure 1, explain how a rise in temperature from 10 °C to 20 °C affects the loading and unloading of oxygen by haemocyanin.
In your answer, compare what happens at the gills, where the partial pressure of oxygen is high, with what happens in the tissues, where it is low.
(2 marks)
Hint
Find the high pO₂ part of the graph (the gills) and the low pO₂ part (the tissues). Where do the two curves overlap, and where are they different?
Mark Scheme
- At low pO₂ (in the tissues), haemocyanin unloads more oxygen at 20 °C because its affinity is lower (1 mark)
- At high pO₂ (at the gills), temperature has no effect on loading (1 mark)
Also accepted / rejected
Also accepted
- Any pO₂ below about 9 kPa for “low”, and above 9 kPa for “high”
- The converse, that at 10 °C haemocyanin unloads less readily in the tissues
Not accepted
- Haemocyanin loading oxygen in the tissues, or unloading it at the gills
Tips
- Link each part of the curve to a place. High pO₂ (above about 9 kPa) is the gills, low pO₂ is the tissues
- At high pO₂ the two curves overlap, so say temperature has no effect on loading at the gills
- At low pO₂ say haemocyanin unloads more oxygen at 20 °C (it has a lower affinity)
- Don’t say a lower affinity helps haemocyanin load oxygen at the gills. Loading happens at high pO₂, where temperature makes no difference
Haemocyanin is colourless when it carries no oxygen, and turns a deeper blue as more oxygen binds to it.
A scientist wants to find the percentage oxygen saturation of haemocyanin in samples of octopus blood. She already has a set of octopus blood samples in which the percentage oxygen saturation is known.
Explain how she could use these known samples to make a calibration curve, and give one variable she should keep the same while collecting the data.
(3 marks)
Hint
The colour of haemocyanin changes with oxygen saturation. Which piece of equipment measures colour, and what would you plot against what to make the curve?
Mark Scheme
- Measure each known sample with a colorimeter (1 mark)
- Plot absorbance (or transmission) on the y-axis against percentage oxygen saturation on the x-axis, and draw a line or curve of best fit (1 mark)
Variable kept the same
- The same volume of each sample, the same temperature, or the same filter (colour of light) (1 mark)
Also accepted / rejected
Not accepted
- “Calorimeter”
- Absorbance on the x-axis
- “Amount” instead of volume
Tips
- Use a colorimeter (not a calorimeter) to measure the colour of each sample
- Plot absorbance (or transmission) on the y-axis against percentage oxygen saturation on the x-axis
- You are given samples of known saturation, so you don’t need to make a dilution series
- Give a control variable that fits this procedure, such as the same volume of sample (not “amount”), temperature, or the same filter (wavelength of light). “The same colorimeter” doesn’t gain the mark
Scientists measured how long mice could run on a treadmill at different speeds before they got tired and stopped. How long a mouse can keep running depends on how quickly its heart and blood can deliver oxygen to its muscles.
Figure 1 shows the mean time the mice could run for at each speed.
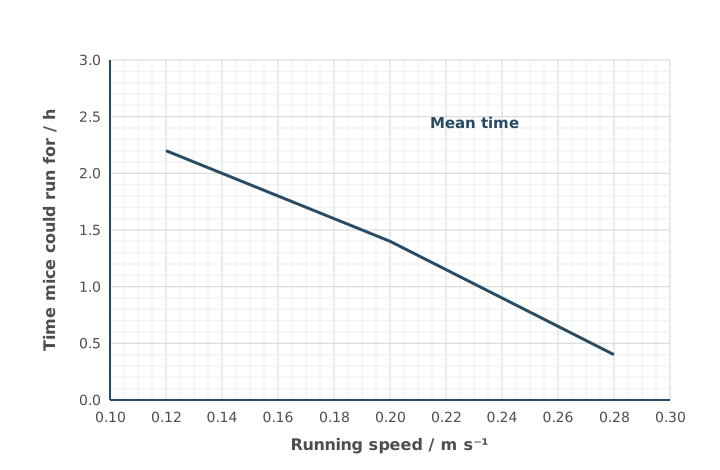
A mouse running at 0.20 m s⁻¹ covered a distance of 360 m in 30 minutes.
Use Figure 1 to calculate the extra distance this mouse could cover if it continued running at 0.20 m s⁻¹ before it stopped running.
Show your working.
Extra distance = ________ m
(2 marks)
Hint
Read the mean running time at 0.20 m s⁻¹ from the graph. The mouse has already run for 30 minutes, so how much longer can it run? Convert that time into seconds before using the speed.
Mark Scheme
648 m (2 marks)
Working:
- At 0.20 m s⁻¹ the mice ran for 1.4 h
- Time left for this mouse: 1.4 − 0.5 = 0.9 h
- In seconds: 0.9 × 3600 = 3240 s
- Distance: 3240 × 0.20 = 648 m
If the answer is wrong, 1 mark for any of:
- reading 1.4 h (84 minutes) from the graph
- the time left: 0.9 h (54 minutes or 3240 s)
- the total distance: 1008 m
- a wrong graph reading used correctly (reading in s × 0.20 − 360)
Tips
- Read the graph carefully. At 0.20 m s⁻¹ the line is at 1.4 h
- Take off the 30 minutes already run (0.9 h left), and convert to seconds before multiplying by the speed
- Always show your working, because a correct method with a misread value still earns 1 mark
Scientists measured how long mice could run on a treadmill at different speeds before they got tired and stopped. How long a mouse can keep running depends on how quickly its heart and blood can deliver oxygen to its muscles. The mice were selected at random from one breeding colony. Before the investigation, the mice were equally rested and fed identical diets.
Figure 1 shows the time each mouse ran for, and a line the scientists drew joining the mean time at each speed.
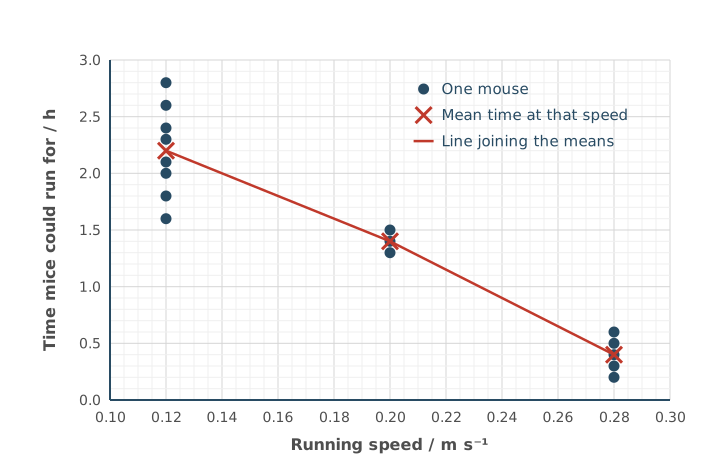
A student wants to use the line to predict how long a mouse could run at 0.16 m s⁻¹.
Use information in Figure 1 to explain why this prediction may not be reliable.
(3 marks)
Hint
Is there any data at 0.16 m s⁻¹? How many speeds were tested? Compare the number of mice, and the spread of their times, at each speed.
Mark Scheme
Max 3 marks
- Only three speeds were tested, so there is no data near 0.16 m s⁻¹ (1 mark)
- The number of mice differs at each speed (1 mark)
- The spread (range) of times differs at each speed (1 mark)
- The sample is small (few mice) (1 mark)
Tips
- Point out that only three running speeds were investigated, so the line is guessed between them, and that the sample was small
- Look at how the data are spread. The number of mice differed at each speed, and each speed covered a different range of times
- The line already joins mean values, so don’t suggest using means, or medians instead
- Don’t suggest adding error bars or mention anomalies unless the data show them
Pollen grains are made inside the anthers of flowers:
- each diploid cell in an anther goes through four mitotic divisions
- each of the cells this produces then goes through one meiotic division to make pollen grains.
Calculate the minimum number of diploid cells needed to produce 3.6 × 10⁶ pollen grains.
Give your answer in standard form.
Show your working.
Answer = ________ diploid cells
(2 marks)
Hint
Each mitotic division doubles the number of cells. How many cells does one diploid cell give after four divisions, and how many pollen grains does each of those make by meiosis?
Mark Scheme
5.625 × 10⁴ (2 marks)
Working:
- Four mitotic divisions: 2⁴ = 16 cells
- Each makes 4 pollen grains: 16 × 4 = 64 pollen grains per diploid cell
- 3.6 × 10⁶ ÷ 64 = 5.625 × 10⁴
If the answer is wrong, 1 mark for any of:
- 16 (2⁴) cells after four mitotic divisions
- 2.25 × 10⁵ (3.6 × 10⁶ ÷ 16)
- 64 (2⁶) pollen grains from one diploid cell
- the right answer but not in standard form (56 250)
Also accepted / rejected
Also accepted
- Correct rounding, e.g. 5.6 × 10⁴ or 6 × 10⁴
Tips
- “One meiotic division” means one complete meiosis, so each cell produces 4 pollen grains, not 2. Using 2⁵ (32) instead of 2⁶ (64) is a common error
- Give your final answer in standard form, as the question asks
- Round correctly: 5.625 × 10⁴ rounds to 5.6 × 10⁴, not 5.7 × 10⁴
A diploid cell in an anther goes through interphase before a meiotic division that produces pollen grains.
A scientist determined that the mass of DNA in one of these cells at the start of interphase is 6 arbitrary units.
Draw a bar chart showing the mass of DNA in one cell in each of these phases:
- at the start of interphase
- at the end of interphase
- at the end of the first meiotic division
- at the end of the second meiotic division.
(3 marks)
Hint
DNA replicates during interphase. What happens to the mass of DNA in one cell after each of the two meiotic divisions?
Mark Scheme
- Bars labelled with the four phases, y-axis labelled DNA mass per cell / arbitrary units, a linear scale and bars not touching (1 mark)
- 6 at the start of interphase and 12 at the end (1 mark)
- 6 after the first meiotic division and 3 after the second (1 mark)
For example,
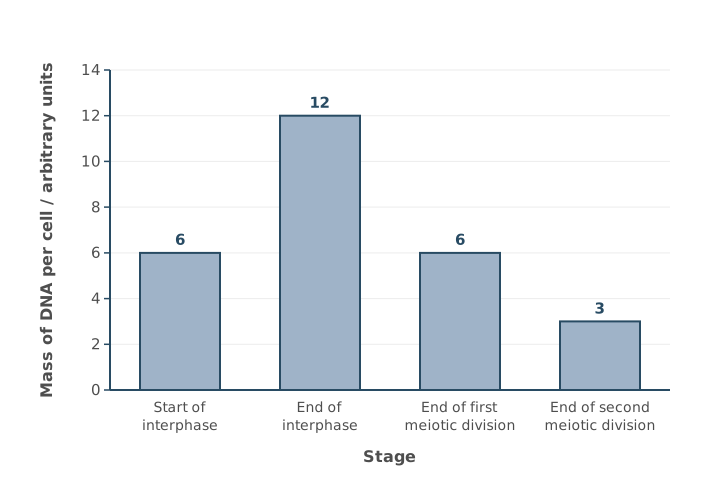
Also accepted / rejected
Also accepted
- If points 2 and 3 are wrong, 1 mark for bars that show the DNA mass halving in each meiotic division
Not accepted
- A y-axis scale that is too small to read the values
Tips
- Label the y-axis fully, as DNA mass per cell (arbitrary units)
- Leave gaps between the bars, because this is a bar chart, not a histogram
- Use a linear scale on the y-axis that is large enough to read the values
- Plot the right values: 6 at the start of interphase, 12 at the end (the DNA has replicated), 6 after the first meiotic division and 3 after the second
Some gametes have one fewer chromosome than normal, because of a mutation during meiosis.
Name this type of mutation and explain how it happens.
(3 marks)
Hint
Name the mutation where chromosomes fail to separate. Then think about where both chromosomes (or both chromatids) of a pair end up during the division, and what that leaves for the other cell.
Mark Scheme
Max 3 marks
- Non-disjunction (1 mark)
- Homologous chromosomes (or sister chromatids) fail to separate (1 mark)
- Both chromosomes (or chromatids) of the pair move to the same pole, e.g. because they are not attached to the spindle fibres (1 mark)
Also accepted / rejected
Also accepted
- “Monosomy” or “aneuploidy” (point 1)
- A labelled diagram showing both chromosomes moving to one pole (point 3)
Not accepted
- Polyploidy, or changes in whole sets of chromosomes
Tips
- Name the mutation as non-disjunction, and spell it carefully (not “non-disfunction”). Polyploidy (changes in whole sets) is not accepted
- Say that homologous chromosomes (or chromatids) fail to separate
- Explain what happens. Both chromosomes (or chromatids) of the pair move to the same pole, e.g. because they are not attached to the spindle fibres, so the other gamete gets neither
- Don’t just restate that the gamete is missing a chromosome; the question already tells you that
Antibiotic resistance alleles are often located in plasmids.
There are 9 different types of plasmid inside cells of a species of soil bacterium.
A scientist determined the:
- length of each type of plasmid in kilobase pairs (kbp)
- mean plasmid copy number (mean number of each type of plasmid per cell).
Table 1 shows the scientist’s results for 5 of these plasmids.
Table 1
| Plasmid | Plasmid length / kbp | Mean plasmid copy number | Rank of plasmid length | Rank of mean plasmid copy number | Squared difference between ranks (d²) |
|---|---|---|---|---|---|
| R | 40 | 22 | 3 | 3 | 0 |
| P | 3 | 85 | 1 | 4 | 9 |
| T | 260 | 5 | 5 | 2 | 9 |
| Q | 9 | 120 | 2 | 5 | 9 |
| S | 110 | 2 | 4 | 1 | 9 |
The Spearman rank correlation coefficient (rs) between plasmid length and mean plasmid copy number is determined using this equation.
rs = 1 − 6Σd²n(n² − 1)
where
- Σd² = the sum of all d² figures
- n = 5 (the highest rank number)
Use information in Table 1 and the formula to calculate the rs value for this set of data.
Show your working.
rs = ________
(2 marks)
Hint
The d² values are already in the table, so just add them up. Work out the top and bottom of the fraction separately, divide, then subtract the result from 1.
Mark Scheme
−0.8 (2 marks)
Working:
- Σd² = 36
- Top of the fraction: 6 × Σd² = 6 × 36 = 216
- Bottom of the fraction: n(n² − 1) = 5 × (25 − 1) = 120
- Top ÷ bottom: 216 ÷ 120 = 1.8
- rₛ = 1 − 1.8 = −0.8
If the answer is wrong, 1 mark for any of:
- 216 (top of the fraction)
- 120 (bottom of the fraction)
- 1.8 (the fraction worked out)
- 0.8 (the right number but positive)
Tips
- The last column is already d², so add those numbers (Σd² = 36); don’t square them again
- Keep the “1 −” outside the fraction. Work out 6Σd² ÷ n(n² − 1) first, then subtract it from 1
- Use n = 5 (the number of plasmids), not a value from the table
- Show your working, because a correct numerator (216) or denominator (120) still earns a mark if your final answer is wrong
Scientists investigated the 9 different types of plasmid inside cells of a species of soil bacterium.
They determined that the Spearman rank correlation coefficient (rs) between plasmid length and mean plasmid copy number for all 9 types of plasmid is −0.91
What can you conclude from this rs value?
(1 mark)
Hint
Look at the sign and the size of the value. What do they tell you about the direction and strength of the relationship?
Mark Scheme
- A strong negative correlation (1 mark)
Also accepted / rejected
Also accepted
- “Significant” instead of “strong”
Tips
- State what the value shows. The value −0.91 is close to −1, so there is a strong negative correlation between plasmid length and mean plasmid copy number
The length of the single circular (non-plasmid) DNA molecule in a cell of a species of soil bacterium is 4200 kbp
The total length of all plasmid DNA molecules in a cell is 35% greater than the length of the single circular DNA molecule.
Calculate the total number of kbp in all the plasmid molecules in a cell.
Show your working.
Answer = ________ kbp
(2 marks)
Hint
35% greater means the original length plus another 35% of it. What do you multiply 4200 by?
Mark Scheme
5670 kbp (2 marks)
Working:
- 4200 × 1.35 = 5670
If the answer is wrong, 1 mark for:
- 1470 (the extra 35%), or using × 1.35
Tips
- 4200 × 1.35 = 5670 kbp
- Stop at 5670 kbp, because this is already the total for all the plasmids, so don’t multiply by the number of plasmid types
A scientist grew a culture of a spore-forming bacterium at 25 °C for 18 hours. The population went through three phases (germination, growth and dormancy).
Every hour, the scientist measured:
- the cloudiness of the culture, which increases as the number of cells increases
- the mean number of copies of plasmid P in each cell.
Figure 1 shows the results.
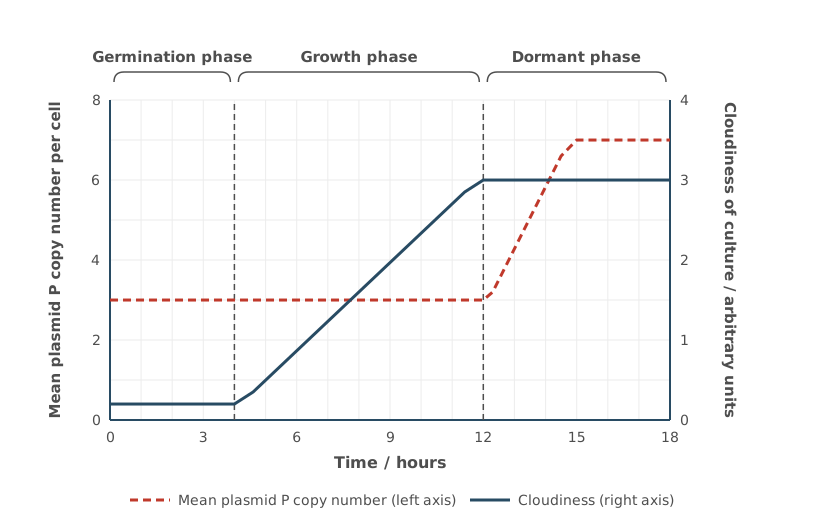
For each phase, use Figure 1 to conclude whether binary fission and the replication of plasmid P are taking place.
(3 marks)
Hint
Cloudiness shows the number of cells, so a rise means binary fission is happening. A rise in copy number per cell means plasmids are replicating faster than the cells divide. If the number of cells rises but the copy number per cell stays the same, what must the plasmids be doing?
Mark Scheme
Max 3 marks
Germination phase
- No binary fission and no plasmid replication (1 mark)
Growth phase
- Binary fission happens and the plasmids replicate (keeping pace with the cells) (1 mark)
Dormant phase
- The plasmids replicate but there is no binary fission (1 mark)
Also accepted / rejected
Also accepted
- Times (e.g. 0 to 4 hours) or “first phase” instead of the phase names
- “Cell division” instead of “binary fission”
Not accepted
- A conclusion that isn’t clearly linked to a phase
Tips
- Don’t just describe the graph (“copy number stayed the same”, “cloudiness plateaued”). Conclude what it means, which is whether binary fission and plasmid replication are happening
- Link each conclusion clearly to a named phase (or its time period)
- Use cloudiness to decide about binary fission, and plasmid copy number to decide about plasmid replication
Figure 1 is an electron micrograph of part of a chloroplast in a leaf cell.
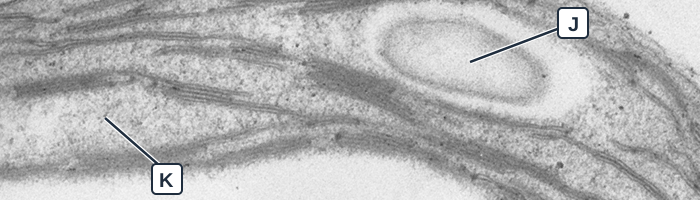
Micrograph: B. Zechmann (2019), PLOS ONE 14(4): e0214811, Fig. 1A, CC BY 4.0. Cropped and labelled.
Identify the parts labelled J and K.
(1 mark)
Hint
J is a pale oval structure, separate from the stacked membranes; think about what a chloroplast stores. K is the granular fluid around the membranes.
Mark Scheme
J is a starch grain (or a lipid droplet) and K is the stroma (1 mark, both needed)
Also accepted / rejected
Not accepted
- “Stoma” for stroma
Tips
- J is a round structure separate from the grana, which is a starch grain (or lipid droplet), not a thylakoid or granum
- A chloroplast is an organelle, so it doesn’t contain a vacuole or nucleus
- K is the stroma; spell it carefully, because a stoma is a pore in a leaf
Some plants grow on the floor of dense forests, where very little light reaches them.
Scientists compared chloroplasts from a forest-floor plant with chloroplasts from a plant of the same species growing in full sunlight. They counted structures in electron micrographs.
Table 1
| Plant in full sunlight | Forest-floor plant | |
|---|---|---|
| Mean number of grana per chloroplast | 30 | 45 |
| Mean number of thylakoids per granum | 6 | 18 |
Use Table 1 to suggest how the chloroplasts of the forest-floor plant help it to photosynthesise in low light.
Justify your answer.
(2 marks)
Hint
What is different about the thylakoids in the forest-floor plant? What pigment do thylakoid membranes contain, and what does it do?
Mark Scheme
- The forest-floor plant has more grana and more thylakoids (1 mark)
- So it has more chlorophyll, absorbs more light and can photosynthesise more in low light (1 mark)
Also accepted / rejected
Also accepted
- “Larger” or “bigger” grana (point 1)
- “More light-dependent reaction” instead of “more photosynthesis” (point 2)
Tips
- Give the full chain for the second mark. More grana (thylakoids), so more chlorophyll, so more light absorbed, so more photosynthesis
- Write “light-dependent reaction” in full, not “LDR”
Scientists studied a pale-green mutant of rice. The mutant has a gene mutation that reduces the activity of an enzyme used to make chlorophyll b. From electron micrographs, they predicted that the mutant would photosynthesise less than normal rice, because its chloroplasts had fewer thylakoids.
Chlorophyll a and chlorophyll b are two types of chlorophyll used in photosynthesis. Table 1 shows the scientists’ results.
Table 1
| Chlorophyll a / µg cm⁻² | Chlorophyll b / µg cm⁻² | Rate of oxygen production in bright light / arbitrary units | |
|---|---|---|---|
| Normal rice | 30 | 10 | 12 |
| Mutant rice | 9 | 1 | 18 |
The results did not support the prediction.
Use Table 1 to describe and explain the effect of the mutation.
(3 marks)
Hint
Work out the total chlorophyll and the ratio of chlorophyll a to chlorophyll b for each plant. Does the mutant have more chlorophyll a overall, or just a larger proportion of chlorophyll a compared with b?
Mark Scheme
- The mutant has less chlorophyll (10 v 40 µg cm⁻²) but a higher rate of photosynthesis (1 mark)
- The mutation increased the ratio of chlorophyll a to chlorophyll b (9 : 1 v 3 : 1) (1 mark)
- So the mutant absorbs more light (1 mark)
Also accepted / rejected
Also accepted
- “Relatively more chlorophyll a than b” (point 2)
- “Absorbs a greater range of wavelengths” (point 3)
Not accepted
- Saying the mutant has more chlorophyll a (it has less, 9 v 30)
Tips
- Describe the key contrast. The mutant has less chlorophyll overall but a higher rate of photosynthesis
- Work out the ratio: 30 : 10 is 3 : 1, and 9 : 1 is higher. The mutant has relatively more chlorophyll a, not more chlorophyll a overall
- Say the mutant absorbs more light (or a greater range of wavelengths), but don’t say this is because it has “more” chlorophyll a
Table 1 shows the formulas of three fatty acids.
Table 1
| Fatty acid | Formula |
|---|---|
| Myristic acid | CH₃(CH₂)₁₂COOH |
| Palmitoleic acid | CH₃(CH₂)₅CH=CH(CH₂)₇COOH |
| Linoleic acid | CH₃(CH₂)₄CH=CHCH₂CH=CH(CH₂)₇COOH |
Which fatty acid in Table 1 is a saturated fatty acid?
(1 mark)
Hint
What feature in a formula tells you a fatty acid is unsaturated? Which formula doesn’t have it?
Mark Scheme
Myristic acid (1 mark)
It has no C=C double bonds in its hydrocarbon chain.
Tips
- A saturated fatty acid has no C=C double bonds; look for “=” in the formulas
The more unsaturated fatty acids there are in the phospholipids of a cell-surface membrane, the more fluid the membrane is.
Amoeba is a single-celled organism that feeds by engulfing bacteria. Scientists grew Amoeba in a liquid rich in unsaturated fatty acids. They found:
- a higher proportion of unsaturated fatty acids in the phospholipids of its cell-surface membrane
- that each Amoeba engulfed more bacteria.
Suggest and explain why each Amoeba engulfed more bacteria.
(3 marks)
Hint
What do more unsaturated fatty acids do to the membrane? Why would that make it easier for the cell to surround and take in a bacterium?
Mark Scheme
- More unsaturated fatty acids in the phospholipids increase the fluidity of the cell-surface membrane (1 mark)
- So the membrane is more flexible (1 mark)
- So it is easier to engulf bacteria (1 mark)
Also accepted / rejected
Also accepted
- Points 1 and 2 together: “more unsaturated fatty acids make the membrane more fluid” earns both
- “Endocytosis” or “phagocytosis” instead of “engulf” (point 3)
Tips
- Link the unsaturated fatty acids to the membrane: they make the cell-surface membrane more fluid; don’t just repeat the question
- Explain how a more fluid membrane makes engulfing easier
- The fatty acids are food, not antigens, so don’t describe an immune response
The epithelial cells lining the ileum have microvilli on their surface.
Describe what microvilli are.
(1 mark)
Hint
Microvilli belong to a single cell. Which part of the cell are they made from?
Mark Scheme
Folds of the cell-surface membrane of a single epithelial cell (1 mark)
Also accepted / rejected
Also accepted
- “Projections” or “extensions” of the cell-surface membrane
Not accepted
- “Hairs”
Tips
- Microvilli are folds of the cell-surface membrane of one cell; villi are made of many cells, and cilia are something else
- “They increase the surface area” is what they do, not what they are
A student cut very thin sections of a plant stem to look at the xylem with an optical microscope.
Explain why the sections needed to be very thin.
(2 marks)
Hint
What does an optical microscope need to pass through the specimen to form an image? What happens with a thick section?
Mark Scheme
- So there is only a single layer (or a few layers) of cells (1 mark)
- So light can pass through (1 mark)
Also accepted / rejected
Also accepted
- “So cells don’t overlap” (point 1)
Tips
- Explain why thin matters: one layer of cells, so light can pass through
- Thin sections don’t improve resolution or magnification
A scientist measured the diameter of five red blood cells on a photomicrograph, using a ruler.
Table 1
| Red blood cell | 1 | 2 | 3 | 4 | 5 |
|---|---|---|---|---|---|
| Diameter on the photomicrograph / mm | 15 | 16 | 14 | 15 | 15 |
The magnification of the photomicrograph is × 2000
Calculate the mean actual diameter of the red blood cells, in µm.
Show your working.
Answer = ________ µm
(2 marks)
Hint
Find the mean diameter on the photomicrograph first. Rearrange magnification = image size ÷ actual size, and check your units.
Mark Scheme
7.5 µm (2 marks)
Working:
- Mean image size: 75 ÷ 5 = 15 mm
- In µm: 15 mm = 15 000 µm
- Actual size = image size ÷ magnification
- 15 000 ÷ 2000 = 7.5 µm
If the answer is wrong, 1 mark for any of:
- actual size = image size ÷ magnification (the equation rearranged)
- ÷ 2000
- 15 000 µm (the mean diameter in µm)
- × 1000 (converting mm to µm)
- 0.0075 (right number but in mm)
- the right digits with the decimal point wrong, e.g. 0.75 or 75
Tips
- Rearrange the equation: actual size = image size ÷ magnification
- Find the mean first (15 mm), convert to µm (× 1000), then divide by 2000
- Check your decimal point: 7.5 µm is about the size of a real red blood cell
A student used a ruler with 1 mm divisions to measure the image of a cell. The measurement was 15 mm.
Give the uncertainty of a measurement made with this ruler, and calculate the percentage error of the 15 mm measurement.
Uncertainty = ± ________ mm
Percentage error = ________ %
(2 marks)
Hint
A length measured with a ruler involves two readings, one at each end. What is the uncertainty of each reading?
Mark Scheme
- Uncertainty = ± 1 mm (1 mark)
- Percentage error = 1 ÷ 15 × 100 = 6.7% (1 mark)
Also accepted / rejected
Also accepted
- Point 2 worked out correctly from a wrong uncertainty, e.g. 13% (from 2 mm), 3.3% (from 0.5 mm) or 0.67% (from 0.1 mm)
Tips
- A ruler length needs two readings (start and end), each ± 0.5 mm, so the uncertainty is ± 1 mm
- Percentage error = uncertainty ÷ measurement × 100
A sports drink contains these sugars: glucose, fructose, galactose and maltose.
How many different monosaccharides does the sports drink contain?
(1 mark)
Hint
Which of these sugars are single sugar units, and which is made of two joined together?
Mark Scheme
3 (glucose, fructose and galactose) (1 mark)
Also accepted / rejected
Also accepted
- Naming glucose, fructose and galactose
Tips
- Maltose is a disaccharide (two glucose units), so don’t count it
“Free sugar” is sugar added to food or drinks, and sugar in honey, syrups and fruit juice.
Health scientists recommend that no more than 5% of the energy we take in each day comes from free sugar.
A 7-year-old child needs 7600 kJ of energy a day. One teaspoon of honey contains 90 kJ of energy from free sugar.
Calculate how many teaspoons of honey would give this child the recommended maximum energy from free sugar in a day.
Number of teaspoons = ________ per day
(1 mark)
Hint
Work out 5% of 7600 kJ first. How many teaspoons of honey give that much energy?
Mark Scheme
4.2 teaspoons (1 mark)
Working:
- 5% of 7600 = 380 kJ
- 380 ÷ 90 = 4.2
Also accepted / rejected
Also accepted
- 4.22, or 5 (rounded up to reach the recommendation)
Not accepted
- 4 (rounding down gives less than the recommended maximum)
Tips
- Use only the free-sugar energy (5% of 7600 kJ = 380 kJ), not the whole daily requirement
- Don’t round 4.22 down to 4
A scientist put a Visking tubing bag of sucrose solution into a beaker of water (Figure 1). Water entered the bag by osmosis. This pushed the solution up the tube and increased the air pressure at the top by 600 kPa.
She then did the experiment again with the same volume of a different sucrose solution. This time the air pressure increased by only 150 kPa.
How did the concentration of the second solution compare with the first? Use the pressure figures to support your answer.
(2 marks)
Hint
Would a weaker or a stronger sucrose solution draw less water into the bag? 150 kPa is what fraction of 600 kPa?
Mark Scheme
- The second solution was more dilute (lower concentration), so there was a smaller water potential gradient and less water moved in (1 mark)
- 150 ÷ 600 = 0.25, so it was diluted 4 times (25% of the original concentration) (1 mark)
Also accepted / rejected
Also accepted
- “Higher (less negative) water potential” (point 1)
- 1 part sucrose solution to 3 parts water, e.g. 25 cm³ solution and 75 cm³ water (point 2)
Tips
- A more dilute solution has a higher water potential, so the gradient is smaller and less water enters the bag
- Use the figures: 150 kPa is a quarter of 600 kPa, so the solution was diluted 4 times
A scientist used an optical microscope to find the mitotic index of cells at different distances from the tip of a garlic root.
Give the word equation used to calculate a mitotic index.
Mitotic index = ________
(1 mark)
Hint
A mitotic index is a proportion. What do you count on top, and what goes underneath?
Mark Scheme
Mitotic index = number of cells in mitosis ÷ total number of cells (in the field of view) (1 mark)
Also accepted / rejected
Also accepted
- “Cells with visible chromosomes” instead of “cells in mitosis”
Not accepted
- Multiplying by 100 (the mitotic index is a proportion, not a percentage)
Tips
- Count the number of cells with visible chromosomes, not the number of chromosomes
- Divide by the total number of cells, not by anything else
A scientist used an optical microscope to find the mitotic index of cells at different distances from the tip of a garlic root.
Figure 1 shows the results.
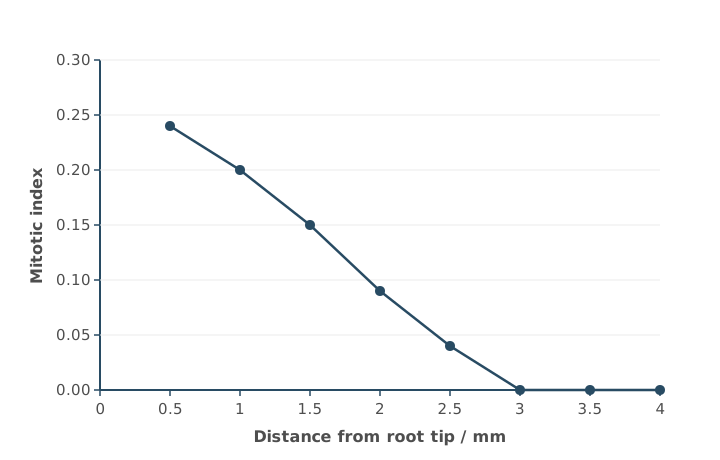
The scientist calculated a correlation coefficient (r) for these data and used a statistical test to find the probability (P) of getting this value of r by chance.
r = − 0.96 (P < 0.01)
What can you conclude from this result?
(2 marks)
Hint
What do the sign and size of r tell you? What does P < 0.01 tell you about the role of chance?
Mark Scheme
Max 2 marks
- A strong (or significant) negative correlation (1 mark)
- There is less than a 1% probability that this correlation is due to chance (1 mark)
- So the null hypothesis is rejected (1 mark)
Also accepted / rejected
Also accepted
- “More than 99% probability that the correlation is not due to chance” (point 2)
- “Relationship” instead of “correlation”
Not accepted
- Saying the “results” or “differences” are significant or not due to chance (point 2)
Tips
- Say the correlation is strong (or significant) and negative; “a negative correlation” alone isn’t enough
- Link P to the correlation and chance: less than a 1% probability that the correlation is due to chance
- Don’t compare the value of r with the value of P
A scientist used an optical microscope to find the mitotic index of cells at different distances from the tip of a garlic root.
Figure 1 shows the results.
What can you conclude about the effect of distance from the root tip on the proportion of cells in different stages of the cell cycle?
Use information from Figure 1.
(3 marks)
Hint
The cell cycle has two main stages: mitosis and interphase. What happens to the proportion of cells in each as you move away from the tip?
Mark Scheme
- A greater proportion of cells are in mitosis closer to the tip (1 mark)
- A greater proportion of cells are in interphase further from the tip (1 mark)
- No cells are in mitosis at 3 mm or more from the tip (all are in interphase) (1 mark)
Also accepted / rejected
Also accepted
- A named stage of mitosis (points 1 and 3)
- G1, S or G2 instead of interphase (points 2 and 3)
Tips
- The cell cycle has two stages, mitosis and interphase: describe the proportion of cells in each
- Link the mitotic index to cells: say more cells are in mitosis near the tip, not just “the mitotic index decreases”
- Interphase counts too: more cells are in interphase further from the tip
- Use the data precisely, e.g. no cells are in mitosis at 3 mm or more
Table 1 shows some mRNA codons and the amino acid each codes for.
Table 1
| mRNA codon | Amino acid |
|---|---|
| CAU | His |
| GGA | Gly |
| GGU | Gly |
| GUA | Val |
| UGG | Trp |
Part of a gene codes for amino acids in the active site of an enzyme. When this part is transcribed, it gives the mRNA sequence CAU GGA UGG.
A mutation in this part of the gene changes the mRNA sequence to CAU GGU UGG.
Use all of this information to:
- name the type of mutation
- give the change in the template strand of the DNA
- explain the effect of the mutation on the function of the enzyme.
(4 marks)
Hint
Which base in the mRNA changed? Work out the matching change in the template DNA. Then use Table 1: does the amino acid change?
Mark Scheme
Type of mutation
- Substitution (of one base) (1 mark)
Change in DNA
- Thymine replaced by adenine in the template strand (CCT becomes CCA) (1 mark)
Effect on the enzyme
- The new codon GGU still codes for Gly, so the amino acid doesn’t change (1 mark)
- So there is no change to the primary structure, the tertiary structure or the active site, and the enzyme works as normal (1 mark)
Also accepted / rejected
Also accepted
- “T to A” for point 2
- Marks can come from any part of the answer
Not accepted
- “Thiamine” for thymine
- Giving the change in the mRNA (A to U) as the change in DNA
Tips
- Use all the information: GGU still codes for Gly, so the amino acid doesn’t change. Not every mutation changes the protein
- Give the change in the DNA, not the mRNA: in the template strand, T is replaced by A
- This works because the genetic code is degenerate: more than one codon codes for Gly
When cut potato is left in air, an enzyme called catechol oxidase catalyses a reaction between colourless compounds in the potato and oxygen. This forms a brown pigment.
A student measured the time taken for the brown pigment to appear on 1 cm cubes of two potato varieties, P and Q, kept at 25 °C. She tested three cubes of each variety.
Her results were:
- variety P: 12 min 18 s, 10 min 48 s, 11 min 30 s
- variety Q: 4 min 42 s, 5 min 12 s, 5 min 30 s
Draw a results table for these data. Include the student’s results and the mean for each variety, with each mean given to 1 decimal place.
(3 marks)
Hint
What goes in the left-hand column? Put each unit in a column heading, and use the same unit for every time.
Mark Scheme
- Variety (P and Q) in the left-hand column (1 mark)
- Column headings include time / min and mean time / min, with units only in the headings (1 mark)
- All times converted correctly and means correct to 1 decimal place (1 mark)
For example,
| Variety | Time 1 / min | Time 2 / min | Time 3 / min | Mean time / min |
|---|---|---|---|---|
| P | 12.3 | 10.8 | 11.5 | 11.5 |
| Q | 4.7 | 5.2 | 5.5 | 5.1 |
Also accepted / rejected
Also accepted
- All times in seconds, e.g. 738, 648, 690 and a mean of 692.0 s
- Means shown in a row instead of a column
Not accepted
- Mixed units, e.g. “minutes and seconds”
Tips
- Convert all the times into one unit before putting them in the table
- Put the unit in the column heading (e.g. Time / min), not next to each number
- Calculate the means correctly and give them to 1 decimal place
- Draw a table, not a bar chart
When cut potato is left in air, an enzyme called catechol oxidase catalyses a reaction between colourless compounds in the potato and oxygen. This forms a brown pigment.
The brown pigment appeared after a mean of 11.5 minutes on variety P, and after 5.1 minutes on variety Q.
Suggest and explain why the results for the two varieties are different.
(2 marks)
Hint
Which variety reacted faster? What could there be more of in that variety?
Mark Scheme
- Variety Q has more substrate, more enzyme or more active enzyme (1 mark)
- So more enzyme-substrate complexes form (1 mark)
Also accepted / rejected
Also accepted
- The opposite for variety P (less substrate or enzyme)
Tips
- A shorter time means a faster reaction, so Q has more substrate or enzyme (or more active enzyme)
- Go on to say more enzyme-substrate complexes form
- Stick to substrate and enzyme; don’t bring in temperature
When cut potato is left in air, an enzyme called catechol oxidase catalyses a reaction between colourless compounds in the potato and oxygen. This forms a brown pigment.
A student timed how long the brown pigment took to appear on cubes of potato. She then repeated the investigation with one change to her method, and the brown pigment appeared sooner.
Suggest what the change could have been, and explain why the pigment appeared sooner. Do not suggest using a different mass or volume of potato.
(3 marks)
Hint
Which factors affect the rate of an enzyme-controlled reaction? Choose one the student could change, then follow the chain to a faster reaction.
Mark Scheme
Max 3 marks, from one of these routes:
Raise the temperature
- Keep the potato at a higher temperature (closer to the optimum) (1 mark)
- So the molecules have more kinetic energy (1 mark)
- So more enzyme-substrate complexes form and the reaction is faster (1 mark)
Use the optimum conditions
- Use the enzyme’s optimum temperature or optimum pH (1 mark)
- So less of the enzyme is denatured (1 mark)
- So more enzyme-substrate complexes form and the reaction is faster (1 mark)
Cut it up
- Crush, grind or chop the potato (1 mark)
- So more enzyme and substrate come into contact with oxygen (1 mark)
- So more enzyme-substrate complexes form and the reaction is faster (1 mark)
Also accepted / rejected
Also accepted
- “Change the temperature”, as long as the explanation is right (points 1 and 4)
- Dicing, slicing or homogenising (point 7)
Tips
- A shorter time means a faster reaction
- Give the direction of any temperature change, e.g. increase it towards the optimum
- A higher temperature gives more kinetic energy and more enzyme-substrate complexes; it doesn’t lower the activation energy
- If you cut the potato, say more enzyme and substrate come into contact with oxygen, not just “a larger surface area”
When cut potato is left in air, an enzyme called catechol oxidase catalyses a reaction between colourless compounds in the potato and oxygen. This forms a brown pigment.
A student wants to measure the activity of catechol oxidase as the amount of product made.
Which method would work?
Tick (✓) one box.
Hint
Think about what each method actually measures, and whether it could work with a solid cube of potato.
Mark Scheme
D) Compare the brown colour of the potato with a colour chart (1 mark)
Tips
- Answer D: comparing the brown colour with a colour chart of known pigment concentrations measures how much product has formed
- The colorimeter (A) is the most common wrong answer. A colorimeter shines light through a liquid sample in a cuvette, so it can’t be used on a solid cube of potato: light can’t pass through it
- Check how a method would actually work, not just whether it involves colour
Plaques can build up in the walls of the carotid arteries, which carry blood to the brain. A plaque can break open and cause a blood clot, which can lead to a stroke. As a plaque builds up, it also makes the artery wall thicker.
Scientists measured the thickness of the carotid artery wall (t) in a large population of people over 60 years old. They worked out each person’s risk of a plaque forming.
Table 1
| Wall thickness, t / mm | Number of people | Risk of a plaque forming / % |
|---|---|---|
| t ≤ 0.8 | 1850 | 2 |
| 0.8 < t ≤ 1.0 | 1020 | 5 |
| 1.0 < t ≤ 1.2 | 260 | 14 |
| t > 1.2 | 12 | 61 |
Using all the information, what can you conclude about carotid artery wall thickness and the risk of a stroke?
(3 marks)
Hint
Link the risk of a plaque to the risk of a stroke. Look at how the risk changes, how many people are in each group, and what a thick wall could already mean.
Mark Scheme
Max 3 marks
- As wall thickness increases, the risk of a plaque, and so of a stroke, increases (1 mark)
- Few people (12) are in the highest-risk group (1 mark)
- People with walls thicker than 1.2 mm have a much higher risk (61%), so may have a stroke (1 mark)
- A high risk doesn’t mean a plaque has formed or that a stroke will happen (1 mark)
Also accepted / rejected
Also accepted
- The opposite, e.g. thin walls (1.0 mm or less) mean a low risk (point 1)
- “Most people are at low risk” (point 2)
- “The risk rises steeply above 1.2 mm” (point 3)
Tips
- Link the data to strokes, not just to plaques
- Use the > sign carefully: the highest-risk group is thicker than 1.2 mm
- Only 12 people are in the highest-risk group, but the study itself was large (over 3000 people)
- A thick wall may already be the result of a plaque, and a plaque doesn’t always lead to a stroke
After a heart attack, part of the heart muscle can be damaged. A scientist compared a damaged heart with a healthy heart.
For each heart, the scientist found:
- the mean volume of blood in a full ventricle, just before it contracts (BVB)
- the mean ejection fraction (EF), the proportion of the blood in a full ventricle that is pumped out in one heartbeat.
EF = stroke volumeBVB
Table 1
| Heart | BVB / cm³ | EF |
|---|---|---|
| Healthy | 125 | 0.60 |
| Damaged | 140 | 0.34 |
Calculate the percentage change in stroke volume of the damaged heart compared with the healthy heart.
Answer = ________ %
(2 marks)
Hint
Rearrange the equation to find each stroke volume. For a percentage change, which heart’s value goes on the bottom?
Mark Scheme
−36.5% (2 marks)
Working:
- Stroke volume = EF × BVB
- Healthy: 0.60 × 125 = 75.0 cm³
- Damaged: 0.34 × 140 = 47.6 cm³
- Percentage change: (47.6 − 75.0) ÷ 75.0 × 100 = −36.5%
If the answer is wrong, 1 mark for any of:
- 47.6 (stroke volume of the damaged heart)
- 75 (stroke volume of the healthy heart)
- 27.4 (the difference between them)
Also accepted / rejected
Also accepted
- 36.5, 36.53, 37 or 40, positive or negative (points 1 and 2)
Tips
- Rearrange EF to find each stroke volume: stroke volume = EF × BVB
- Divide the difference by the healthy heart’s stroke volume (the starting value); dividing by the damaged heart’s gives −57.6%
- Round sensibly: −36.53 is −36.5 to 3 significant figures
Courtship in the three-spined stickleback involves male fish:
- performing a zigzag dance to attract sexually active females
- leading a female to his nest to start mating
- chasing females away when the male is not sexually active.
In a control population of 650 sexually active males, each male showed only one of these behaviours.
Table 1
| Behaviour | Percentage of males |
|---|---|
| Zigzag dance | 91 |
| Chasing females away | 3 |
Calculate the number of males in this population that led a female to the nest.
Answer = ________ males
(1 mark)
Hint
There are three behaviours, but only two are in the table. What percentage of males is left over?
Mark Scheme
39 males (1 mark)
Working:
- Percentage that led a female to the nest: 100 − 91 − 3 = 6%
- 6% of 650 = 39
Tips
- Include all three behaviours: 100 − 91 − 3 = 6%
- Give a number of males, not a percentage
Courtship in the three-spined stickleback involves male fish:
- performing a zigzag dance to attract sexually active females
- leading a female to his nest to start mating
- chasing females away when the male is not sexually active.
Scientists were studying courtship in a tank containing only sexually active male sticklebacks. Very few of the males led a female to their nest.
Suggest one change the scientists could make so that more of the males lead a female to their nest.
(1 mark)
Hint
What triggers a male to lead a female to his nest?
Mark Scheme
Add (sexually active) females (1 mark)
Tips
- Adding sexually active females triggers this behaviour; adding more males, food or hormones doesn’t
Toxoplasma gondii is a single-celled parasite. Scientists looked at T. gondii cells with an electron microscope and concluded that it is a eukaryote.
Other than the Golgi apparatus, name one structure the scientists could have seen that shows T. gondii is a eukaryote.
(1 mark)
Hint
Which structures are found in eukaryotic cells but never in prokaryotic cells?
Mark Scheme
Any membrane-bound organelle, e.g. nucleus (or nuclear envelope), mitochondrion, rough endoplasmic reticulum or vesicles (1 mark)
Also accepted / rejected
Also accepted
- Lysosomes, nuclear pores, or 80S (larger) ribosomes
Not accepted
- Nucleolus, smooth endoplasmic reticulum or cell-surface membrane
Tips
- Name a structure found only in eukaryotic cells, such as the nucleus or mitochondria
- Don’t give structures that prokaryotes also have (cell-surface membrane, ribosomes on their own) or structures of plants or bacteria (cell wall, vacuole, plasmid)
Schistosomiasis is a disease caused by parasitic worms. There are about 240 million cases worldwide.
- 90% of cases are in Africa. Schistosoma japonicum is not found in Africa, so it causes none of these cases.
- Outside Africa, S. japonicum causes 30% of cases.
Use this information to calculate the number of cases worldwide caused by S. japonicum.
Answer = ________ cases
(1 mark)
Hint
How many cases are outside Africa? What is 30% of that number?
Mark Scheme
7 200 000 (7.2 million) cases (1 mark)
Working:
- Cases outside Africa: 10% of 240 million = 24 million
- 30% of 24 million = 7.2 million
Also accepted / rejected
Also accepted
- Any correct equivalent, e.g. 7.2 × 10⁶
Tips
- Work out the cases outside Africa first (10% of 240 million = 24 million), then take 30% of that
- Don’t take 30% of the total, or add the two percentages together
Diphtheria is caused by a bacterium that releases a toxin. The toxin damages cells in the throat and heart. Not everyone infected with the bacterium becomes ill.
Scientists measured the concentration of anti-toxin antibody in the blood of three groups of people:
- people infected who had no symptoms
- people infected who had symptoms
- people who were not infected.
Figure 1 shows their results.
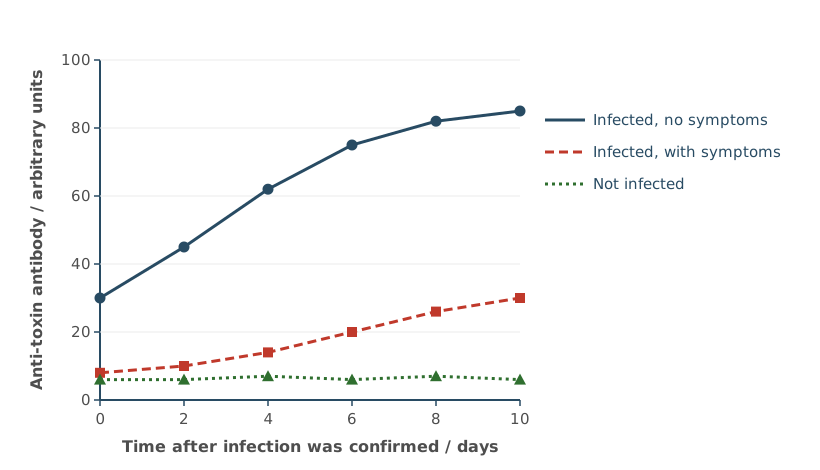
Anti-toxin antibodies can be made in horses and injected into patients. This gives passive immunity.
Use Figure 1 to suggest how the injected antibody would work, and which people should be given it.
You do not need to describe clonal selection or memory cells in your answer.
(3 marks)
Hint
What does an anti-toxin antibody do to the toxin? Which group in Figure 1 has the most antibody and which has the least, and how does that link to becoming ill?
Mark Scheme
- The antibodies bind to the toxin and neutralise it (1 mark)
- Figure 1: infected people without symptoms have the highest antibody concentration, so the antibody prevents illness (1 mark)
- Give it to infected people with symptoms (who have low antibody) (1 mark)
Also accepted / rejected
Also accepted
- The antibodies destroy the toxin, cause agglutination or phagocytosis of it, or stop it binding to and damaging cells (point 1)
- The opposite for point 2: infected people with symptoms have the lowest antibody concentration
- Infected people with a low antibody concentration (point 3)
Not accepted
- Antibodies destroying the bacteria (point 1: it’s the toxin)
Tips
- Say what the antibody does to the toxin (neutralises it), not to the bacteria
- Use Figure 1: infected people without symptoms have the most antibody, so give it to infected people with symptoms (low antibody)
- The antibody levels in Figure 1 are the people’s own response, not from injections
- Passive immunity means the injected antibodies act straight away, without clonal selection or memory cells
Antibodies used as medicines are injected. If they were swallowed, they would be digested in the gut before they could work.
Describe how an antibody would be digested.
(3 marks)
Hint
What type of molecule is an antibody? Which enzymes digest it, and where does each one act?
Mark Scheme
Max 3 marks
- Hydrolysis of peptide bonds (1 mark)
- Endopeptidases break peptide bonds within the polypeptide (1 mark)
- Exopeptidases break the peptide bonds at the ends (1 mark)
- Dipeptidases (membrane-bound) break dipeptides into amino acids (1 mark)
Also accepted / rejected
Also accepted
- “Hydrolyse” or “act on” for break (points 2 to 4)
- “Terminal bonds” for bonds at the ends (point 3)
Not accepted
- Swapping endopeptidases and exopeptidases
Tips
- An antibody is a protein, so it is digested by proteases
- Hydrolysis breaks the peptide bonds between amino acids, not the amino acids themselves
- Endopeptidases act on bonds within the chain, exopeptidases on the end bonds; dipeptidases on the epithelial cell membranes break dipeptides into amino acids
- Stomach acid, amylase and absorption aren’t asked for
A student cut a well (a hole) in the agar of a plate of bacteria. The well had a diameter of 8 mm. She needed to put 80 mm³ of clove oil into the well.
Calculate the minimum depth of the well needed to hold 80 mm³ of clove oil.
Use this equation, with π = 3.14:
Volume of a cylinder = πr² × l
Show your working.
Answer = ________ mm
(2 marks)
Hint
Is the 8 mm a radius or a diameter? Rearrange the equation to find l.
Mark Scheme
1.59 mm (2 marks)
Working:
- Radius: 8 ÷ 2 = 4 mm
- πr² = 3.14 × 4² = 50.24 mm²
- l = 80 ÷ 50.24 = 1.59 mm
If the answer is wrong, 1 mark for any of:
- 50.24 (or 50.2 or 50.3), the area of the end of the well
- 0.398 (using the diameter instead of the radius)
Also accepted / rejected
Also accepted
- 1.6 or 2 (correct rounding)
- 1.5915 (using π on a calculator)
Tips
- Use the radius (4 mm), not the diameter (8 mm)
- Rearrange: depth = volume ÷ πr² = 80 ÷ 50.24
- Show your working; the area (50.24) still earns a mark if the final answer is wrong
A student tested the effect of clove oil on five species of bacteria. For each species, she measured the diameter of the clear zone around a disc of clove oil and around a disc of a positive control, to the nearest mm.
Table 1
| Bacterial culture | Diameter of clear zone with clove oil / mm | Diameter of clear zone with positive control / mm |
|---|---|---|
| Escherichia coli | 14 | 18 |
| Staphylococcus aureus | 19 | 22 |
| Bacillus subtilis | 16 | 20 |
| Pseudomonas fluorescens | 11 | 15 |
| Micrococcus luteus | 15 | 20 |
| Median | ||
| Mean |
Complete Table 1 by giving the median and the mean diameter for each column.
(1 mark)
Hint
What must you do to the values before you can find the median? Give your answers to the same precision as the measurements.
Mark Scheme
| Clove oil | Positive control | |
|---|---|---|
| Median | 15 | 20 |
| Mean | 15 | 19 |
All four values correct (1 mark)
Tips
- Put the values in order before finding the median: for clove oil, 11, 14, 15, 16, 19 gives 15, not 16
- Give the values to the same number of significant figures as the data
Before DNA sequencing was available, bacteria were classified using features seen with an optical microscope, including the number of flagella on each cell and where they were attached.
Some facts about bacterial flagella:
- species in the same genus often have the same pattern of flagella
- flagella break off cells easily
- flagella take up stains poorly
- a flagellum can point in any direction from the cell.
Consider how accurate this method of classification was, and its limitations.
(3 marks)
Hint
Use each fact in turn: what problem would it cause when looking down an optical microscope? And what about the microscope itself?
Mark Scheme
Max 3 marks
- It can’t tell species apart (in the same genus) (1 mark)
- An optical microscope has low resolution (1 mark)
- Flagella may be broken off or missing, or other structures mistaken for flagella (1 mark)
- Flagella are hard to stain, so they may not be seen (1 mark)
- Flagella pointing out of the plane of view may not be seen (1 mark)
- Not all bacteria have flagella (1 mark)
Also accepted / rejected
Not accepted
- “Low magnification” (point 2: it’s resolution)
- “Hard to stain” without saying they can’t be seen (point 4)
Tips
- Use the information: species in the same genus share flagella patterns, so they can’t be told apart
- Say optical microscopes have low resolution, not low magnification
- Explain each limitation: flagella break off, are hard to stain so aren’t seen, or point out of the plane of view
Carbon monoxide (CO) binds to haemoglobin to form carboxyhaemoglobin (COHb). To avoid long-term harm, a health agency aims to keep COHb below 2.5% of a person’s haemoglobin.
The agency recommends that people should not breathe:
- air with more than 40 mg m⁻³ CO for more than 1 hour
- air with more than 12 mg m⁻³ CO for more than 8 hours.
Scientists used a computer model to predict the COHb of an adult and a child, sitting at rest, breathing air at each of these limits. Figure 1 shows their predictions.
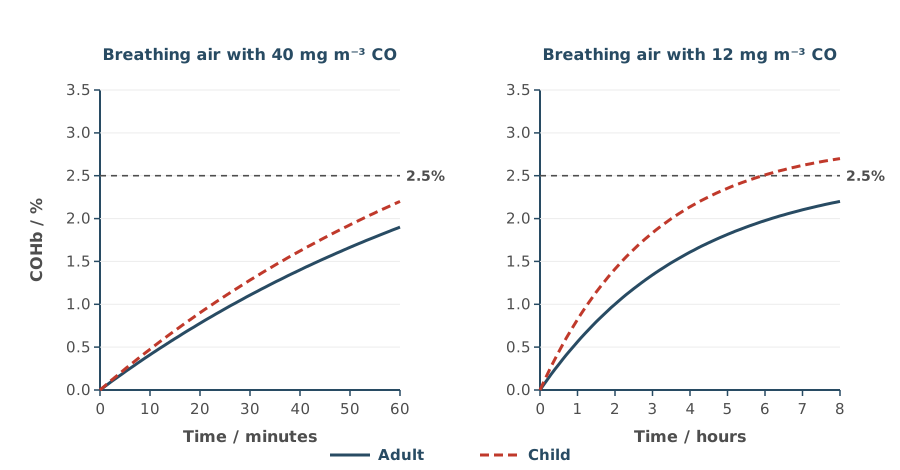
The scientists concluded that the agency’s limits for CO should be lowered.
Evaluate the scientists’ conclusion.
(3 marks)
Hint
Compare each curve with the 2.5% line. Which ones cross it, and which stay below? Then think about who the predictions apply to, and whether the differences have been tested.
Mark Scheme
Max 3 marks: must include point 1 or point 2
Supports the conclusion
- A child breathing the 8-hour limit (12 mg m⁻³) goes above 2.5% COHb (about 2.7% after 8 hours) (1 mark)
Doesn’t support the conclusion
- The adult at both limits, and the child at the 1-hour limit, stay below 2.5% COHb (1 mark)
Limitations
- Only for people at rest; the effect of exercise is unknown (1 mark)
- People vary, e.g. in size, age or sex (1 mark)
- No statistical test, so we don’t know if the differences are significant (1 mark)
- The effect on people with respiratory disease, or on smokers, is unknown (1 mark)
- It may not be possible to lower CO in the air below 12 mg m⁻³ (1 mark)
Also accepted / rejected
Also accepted
- A named respiratory disease, e.g. asthma (point 6)
Tips
- Compare each curve with the 2.5% line: only the child at the 8-hour limit goes above it, so only this supports lowering a limit
- Say clearly whether each piece of data supports the conclusion or not
- Then give limitations: only for people at rest, people vary, and no statistical test was done
Scientists tested drug Z as a possible treatment for cancer. Drug Z stops cytokinesis by inhibiting an enzyme, enzyme E.
Figure 1 shows drawings of cancer cells seen with an optical microscope. One sample was treated with drug Z and one was not.
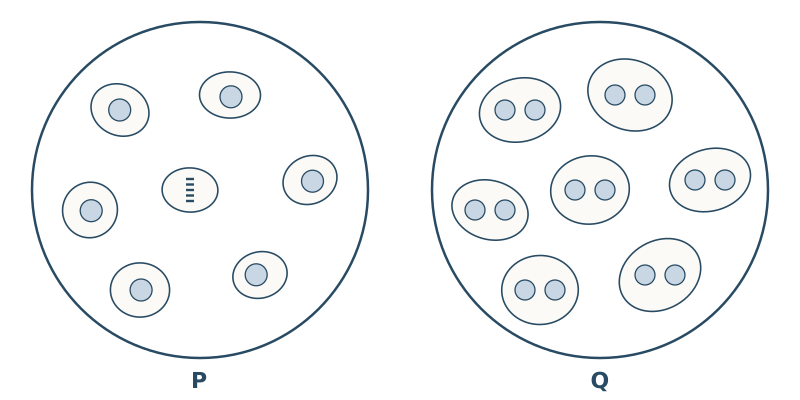
Explain why the cells in drawing Q must be the ones treated with drug Z.
(2 marks)
Hint
Count the nuclei in each cell in Q. Which step of cell division has not happened?
Mark Scheme
- The cells in Q have two nuclei (1 mark)
- Because cytokinesis was prevented: the cytoplasm didn’t divide after the nucleus divided (1 mark)
Also accepted / rejected
Also accepted
- The cells stopped at telophase (point 1)
- The cell-surface membrane didn’t pinch in to form two cells (point 2)
Tips
- Say the cells in Q have two nuclei, and link this to cytokinesis being prevented
- The two round shapes in each cell are nuclei, not separate cells
Drug Z is a non-competitive inhibitor of enzyme E.
Suggest how drug Z makes enzyme E inactive.
(3 marks)
Hint
Where does a non-competitive inhibitor bind? What does that do to the active site?
Mark Scheme
- Drug Z binds to enzyme E at a site other than the active site (1 mark)
- This changes the tertiary structure, so the active site changes shape (1 mark)
- The active site is no longer complementary to the substrate, so fewer enzyme-substrate complexes form (1 mark)
Also accepted / rejected
Also accepted
- “Allosteric site” (point 1)
- “The substrate can no longer bind (fit) to the active site” (point 3)
Not accepted
- Drug Z binding to the substrate (point 1)
- “Loss of specificity” without saying the active site is no longer complementary (point 3)
Tips
- A non-competitive inhibitor binds to the enzyme at a site other than the active site (an allosteric site), not to the substrate
- This changes the tertiary structure, so the active site changes shape
- Finish the chain: the active site is no longer complementary, so the substrate can’t bind
Scientists tested drug Z as a possible treatment for cancer. Drug Z inhibits an enzyme, enzyme E. Enzyme E is needed for cytokinesis, and it also stops cells from dying.
The scientists grew 4000 cancer cells in a dish with no drug Z (the control), and 4000 cells in each of eight dishes with different concentrations of drug Z. After 72 hours, they counted the cells in each dish.
Figure 1 shows their results.
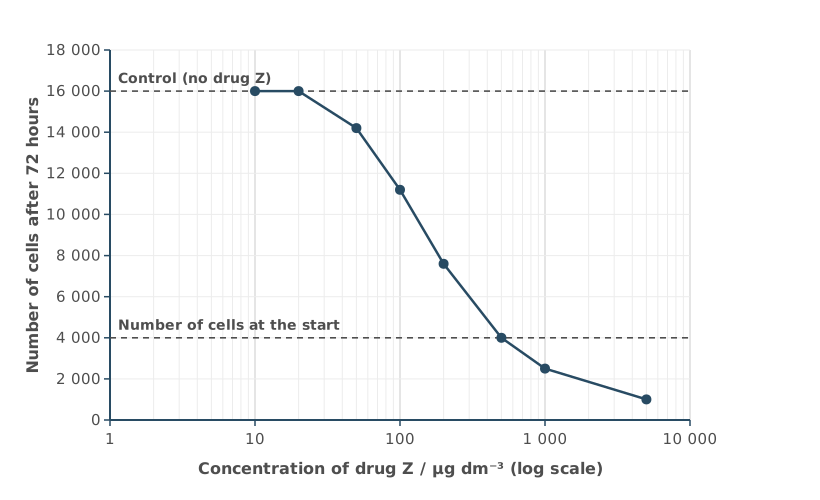
Use all the information to explain the results in Figure 1.
(3 marks)
Hint
Split the graph into three parts: low, middle and high concentrations. Compare the count with the two dashed lines. For each part, what is happening to enzyme E, to cytokinesis and to cell death?
Mark Scheme
- At the lowest concentrations (10 to 20 µg dm⁻³), enzyme E is not inhibited, so the number of cells is the same as the control (1 mark)
- As the concentration increases, more enzyme E is inhibited, so there is less cytokinesis and more cell death (1 mark)
- At the highest concentrations (above 500 µg dm⁻³), all enzyme E is inhibited, so cells die (fewer than the 4000 cells at the start) (1 mark)
Also accepted / rejected
Also accepted
- Drug Z having no effect at the lowest concentrations (point 1)
- “Mitosis” or “cell division” for cytokinesis
- No change in cell number at 500 µg dm⁻³ (point 2)
Tips
- Explain, don’t just describe: link each part of the graph to enzyme E being inhibited (less cytokinesis, more cell death)
- Describe the trend: as the concentration increases, more enzyme E is inhibited
- Read the log scale carefully: the count equals the control at 10 to 20 µg dm⁻³, and there is no growth (still 4000 cells) at 500 µg dm⁻³
Scientists tested drug Z as a possible treatment for cancer. Drug Z inhibits an enzyme, enzyme E. Enzyme E is needed for cytokinesis, and it also stops cells from dying.
The scientists grew 4000 cancer cells in a dish with no drug Z (the control), and 4000 cells in each of eight dishes with different concentrations of drug Z. After 72 hours, they counted the cells in each dish.
Figure 1 shows their results.
Each dish contained 0.02 dm³ of drug Z solution.
Calculate the increase in the mass of drug Z (in µg) needed to go from the same number of cells as the control to no growth (4000 cells after 72 hours).
Show your working.
Answer = ________ µg
(2 marks)
Hint
Read the two concentrations from the graph (watch the log scale). Find the difference, then use the volume to turn a concentration into a mass.
Mark Scheme
9.6 µg (accept 9.6 to 9.8) (2 marks)
Working:
- Increase in concentration: 500 − 20 = 480 µg dm⁻³
- Mass: 480 × 0.02 = 9.6 µg
If the answer is wrong, 1 mark for any of:
- 20 (or 10) and 500 read from the graph
- 480 (or 490), the increase in concentration
- × 0.02 (turning a concentration into a mass)
Also accepted / rejected
Also accepted
- 9.8 µg, from 10 and 500 (any value from 10 to 20 for the first reading)
Tips
- Read the log scale correctly: the count equals the control at 10 to 20 µg dm⁻³ and is 4000 (no growth) at 500 µg dm⁻³
- Find the increase in concentration, then multiply by the volume (0.02 dm³) to get the mass
Zika is a disease caused by the Zika virus. Figure 1 shows a test that detects antibodies against the Zika virus in a patient’s blood.
The instructions say that if no line appears at C, the result should be ignored and the test repeated.
Suggest why.
(1 mark)
Hint
To make a line at C, what must have travelled along the strip? Where is C compared with T?
Mark Scheme
A line at C shows that the blood sample has moved along the strip past line T; with no line, the sample may not have reached T (1 mark)
Also accepted / rejected
Also accepted
- The sample and the anti-human antibodies have moved along the test strip
Not accepted
- Only explaining why a colour forms at C
Tips
- Explain what the control line proves: the sample has moved past line T to reach C
- Explaining only why a colour forms at C misses the point
To make a monoclonal antibody for a diagnostic test, scientists injected a mouse with an antigen. They then fused B cells from the mouse with cancer cells.
Suggest why these fused cells can produce monoclonal antibodies continuously.
(2 marks)
Hint
The fused cell has properties from both cells. What does each one contribute?
Mark Scheme
- The cancer cell part means the fused cells divide rapidly (indefinitely) (1 mark)
- The B cell part means the fused cells produce the antibody (1 mark)
Also accepted / rejected
Also accepted
- “Hybridoma” for fused cell
- “Divide by mitosis” (point 1)
- “Plasma cells” for B cells (point 2)
Tips
- Give both parts: the cancer cell part divides rapidly, and the B cell part produces the antibody
- T cells and the immune response in the mouse aren’t relevant
Zika is a disease caused by the Zika virus. Many other diseases spread by mosquitoes cause the same early symptoms, so Zika can be hard to identify. Identifying it early is important, especially in pregnant women.
Scientists compared three tests for Zika:
- a laboratory test: a blood sample is sent from the clinic to a laboratory
- the test currently used in clinics
- a new test to be used in clinics, which detects antibodies against the Zika virus.
They tested blood samples from people known to have Zika, at different times after their symptoms started. Table 1 shows the number of samples that tested positive out of 20 at each time.
Table 1
| Time after symptoms started / days | Laboratory test | Current clinic test | New clinic test |
|---|---|---|---|
| 1–2 | 18 | 4 | 9 |
| 3–4 | 17 | 9 | 13 |
| 5–6 | 12 | 14 | 15 |
| 7–8 | 8 | 17 | 17 |
The scientists recommend that the new test is used to identify Zika in all countries.
Discuss this recommendation. Use all the information given.
(3 marks)
Hint
Compare the new test with both other tests, early and late. Add up the totals. Then think about practical points for clinics in different countries.
Mark Scheme
Max 3 marks; max 2 from points 4 to 6
- In the first 4 days, the new test detects more than the current test but fewer than the laboratory test (1 mark)
- From day 5, the new test is as good as (or better than) the current test, and better than the laboratory test (1 mark)
- In total, the new test (54) detects more than the current test (44) and almost as many as the laboratory test (55) (1 mark)
- The new test is likely to be quicker (1 mark)
- The new test is likely to be cheaper (1 mark)
- Some countries have few laboratories, or few people trained to use them (1 mark)
Also accepted / rejected
Also accepted
- Correct figures or percentages from Table 1 to support points 1 to 3, e.g. 9 out of 20 (45%) compared with 4 (20%) and 18 (90%) on days 1–2
- “Detects more” or “more effective” for “better”
- “More efficient” for quicker (point 4)
Tips
- Compare all three tests, including the current test: early on, the new test detects more than the current test but fewer than the laboratory test
- Use totals or percentages from Table 1 to back up each comparison
- Then consider practical points: the new test is likely to be quicker and cheaper, and some countries have few laboratories
Plants and fungi both have cell walls, but their walls are made of different polymers.
Name the main polymer in the cell walls of plants, and in the cell walls of fungi.
(1 mark)
Hint
Plant cell walls are made from β-glucose. Which polymer is that? Fungal walls contain a related polymer that is also found in insect exoskeletons.
Mark Scheme
Cellulose in plants and chitin in fungi (1 mark)
Also accepted / rejected
Not accepted
- Murein (peptidoglycan): that’s in bacterial cell walls
Tips
- Plant cell walls are made of cellulose and fungal cell walls of chitin; you need both for the mark
- Murein (peptidoglycan) is the polymer in bacterial cell walls, not fungal ones
Scientists set up enclosures of wild flowers containing 0, 1, 2, 4 or 8 species of bee. After three years, they calculated the plant species index of diversity in each enclosure.
Figure 1 shows their results.
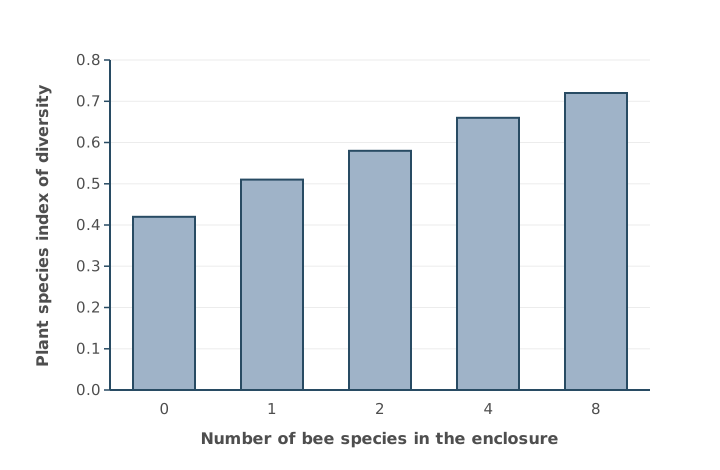
Some land that was used to grow crops has been left to return to its natural state. The plant species index of diversity on this land is different from nearby land that has never been farmed.
Suggest and explain how the plant species index of diversity on the land previously used for crops would be different.
Use Figure 1 and your knowledge of how farming affects biodiversity in your answer.
(2 marks)
Hint
Is the plant diversity likely to be higher or lower on old farmland? How might farming have affected the bees, and what does Figure 1 show happens to plant diversity when there are fewer bee species?
Mark Scheme
- Plant diversity is lower on the land previously used for crops (1 mark)
- Because farming reduces the number of bee species (bee diversity), and Figure 1 shows fewer bee species means lower plant diversity (1 mark)
Also accepted / rejected
Also accepted
- “Farming reduces plant diversity” (point 1)
- A named farming practice that reduces bee species, e.g. using insecticides or removing hedgerows (point 2)
Tips
- Make a prediction: plant diversity is lower on land that was farmed
- Then use Figure 1 to explain it: farming reduces the number of bee species, and fewer bee species means lower plant diversity
- Don’t just list farming practices from memory without linking them to the bees and the data
MRSA is a strain of the bacterium Staphylococcus aureus that is resistant to several antibiotics.
Table 1 shows data from one hospital.
Table 1
| Year | Antibiotic doses used in the hospital / thousands | Percentage of S. aureus infections caused by MRSA |
|---|---|---|
| 1995 | 40 | 5 |
| 2000 | 55 | 18 |
| 2005 | 70 | 35 |
| 2010 | 72 | 41 |
Use Table 1 and your knowledge of natural selection to explain the change in the percentage of S. aureus infections caused by MRSA.
(3 marks)
Hint
Where did resistance come from in the first place? What did the increasing use of antibiotics do to the bacteria that weren’t resistant?
Mark Scheme
- Some bacteria have alleles for resistance (from a mutation) (1 mark)
- Antibiotics act as a selection pressure: non-resistant bacteria die, and resistant bacteria survive and reproduce (1 mark)
- Uses Table 1: as antibiotic use increased (40 to 72 thousand doses), the frequency of the resistance allele increased, so a higher percentage of infections were MRSA (5% to 41%) (1 mark)
Also accepted / rejected
Also accepted
- “Gene” for allele (points 1 and 3)
Not accepted
- Antibiotics causing the resistance mutation (point 1)
- Bacteria becoming “immune” to antibiotics
Tips
- Resistance comes from an allele that some bacteria already have; antibiotics don’t cause the mutation
- Antibiotics are the selection pressure: non-resistant bacteria die, and resistant bacteria survive and reproduce
- Use the table: as antibiotic use went up, the resistance allele became more common, so more infections were caused by MRSA
- Bacteria don’t become “immune”; they have no antibodies
Cellobiose is a disaccharide formed when cellulose is broken down. It is made of two glucose molecules.
Name another disaccharide that is made of two glucose molecules.
(1 mark)
Hint
Which disaccharide is made when amylase breaks down starch?
Mark Scheme
Maltose (1 mark)
Also accepted / rejected
Not accepted
- Maltase (that’s the enzyme)
Tips
- Maltose is made of two glucose molecules; sucrose (glucose and fructose) and lactose (glucose and galactose) are not
- Spell it carefully: maltase is the enzyme that breaks maltose down
A student wanted to grow Escherichia coli on agar plates. So that every plate started with the same number of bacteria, she needed to add exactly 0.5 cm³ of a liquid culture from a conical flask to each plate.
Describe how the student could use aseptic techniques to transfer the culture from the flask onto an agar plate.
(3 marks)
Hint
Think about each step in turn: the bench, the tool for measuring 0.5 cm³, opening the flask, opening the plate and spreading the culture. How do you stop other microorganisms getting in?
Mark Scheme
Max 3 marks
- Disinfect the bench (or wash hands) (1 mark)
- Use a sterile pipette to transfer the culture (1 mark)
- Flame the neck of the flask after removing the bung (1 mark)
- Lift the lid of the plate only slightly (at an angle) (1 mark)
- Work near a Bunsen flame, where air moves upwards (1 mark)
- Spread the culture with a sterile spreader (1 mark)
- Put the used pipette and spreader into disinfectant straight away (1 mark)
Also accepted / rejected
Also accepted
- A pipette or syringe from an unopened pack (point 2)
- Flaming the spreader, or dipping it in alcohol and then flaming it (point 6)
Not accepted
- An inoculating loop to transfer 0.5 cm³ (point 2)
- “The flame sterilises the air” (point 5)
Tips
- Use a sterile pipette to measure a volume like 0.5 cm³; a loop can’t do this
- Lift the lid at an angle rather than taking it off; “work quickly” doesn’t score
- Working near a Bunsen burner helps because rising air carries microbes away, not because it sterilises the air
Some scientists suggested that a food additive, additive F, might be helping antibiotic-resistant strains of Salmonella bacteria to spread.
They grew antibiotic-resistant and non-resistant Salmonella separately in liquid cultures, with and without additive F. Each culture started with the same number of bacteria. After 24 hours, they counted the bacteria.
Table 1
| Salmonella | Number of bacteria after 24 hours, no additive / millions per cm³ | Number of bacteria after 24 hours, with additive F / millions per cm³ |
|---|---|---|
| Non-resistant | 38 | 40 |
| Antibiotic-resistant | 41 | 90 |
Use Table 1 to evaluate whether additive F in the diet could help antibiotic-resistant Salmonella to spread.
(3 marks)
Hint
What does additive F do to each strain? What could that mean if both strains were in the same gut? Then think about how the investigation was done, and what it doesn’t show.
Mark Scheme
Max 3 marks: max 2 if only “for” or only “against”
For
- Resistant bacteria grow faster (reach higher numbers) with additive F (1 mark)
- So the frequency of resistant bacteria in the population is likely to increase (1 mark)
- Resistant bacteria could outcompete non-resistant bacteria (1 mark)
Against
- Done in the laboratory, not in people (1 mark)
- Other substances in the diet might affect the bacteria (1 mark)
- Other species of bacteria in the gut might affect them (1 mark)
- No statistical test to show whether the difference is significant (1 mark)
- The two strains were not grown together (1 mark)
- Only one concentration of additive F was used (1 mark)
Also accepted / rejected
Also accepted
- “Not due to chance” for significant (point 7)
Not accepted
- “No statistical test to see if the results are significant” (point 7: it’s the difference)
Tips
- Give points for and against; one side only gets a maximum of 2 marks
- For: resistant bacteria grow faster with additive F, so they could outcompete non-resistant bacteria and become more common
- Against: it was in the lab, not in people; only one concentration was used; the strains weren’t grown together; and no statistical test was done
- General comments like “correlation doesn’t mean causation” don’t score
Frogs make a polypeptide called magainin in their skin. Magainin kills bacteria by making channels in their cell-surface membranes.
Each magainin molecule is coiled into an α-helix.
Which type of bond holds the α-helix in shape?
Tick (✓) one box.
Hint
The α-helix is secondary structure. Which bonds form between the amino acids in a coiled chain?
Mark Scheme
C: Hydrogen bonds (1 mark)
Tips
- The α-helix is secondary structure, held by hydrogen bonds; peptide bonds join the amino acids in the primary structure
Frogs make a polypeptide called magainin, which kills bacteria by making channels in their cell-surface membranes.
Each magainin molecule is an α-helix with hydrophobic amino acids on one side and hydrophilic amino acids on the other. Several helices line up in a ring across the membrane, and ions pass through the middle of the ring.
Suggest how the hydrophobic and hydrophilic sides of the helices allow them to sit across the membrane and form a channel for ions.
(2 marks)
Hint
Which part of the phospholipid bilayer is hydrophobic? In the ring, which way should each side of a helix face: towards the bilayer, or towards the channel?
Mark Scheme
- The hydrophobic side faces the fatty acid tails (the hydrophobic middle of the bilayer) (1 mark)
- The hydrophilic sides face inwards to form the channel, so ions can pass through (1 mark)
Also accepted / rejected
Also accepted
- “Water-soluble” or “polar” substances for ions (point 2)
Tips
- The hydrophobic side of each helix sits against the fatty acid tails in the middle of the bilayer
- The hydrophilic sides line the channel, so ions can pass through
- Check you haven’t swapped hydrophobic and hydrophilic
Frogs make a polypeptide called magainin in their skin. Magainin kills bacteria by entering their cell-surface membranes and forming channels.
Magainin does not damage the frog’s own cells. The frog’s cell-surface membranes contain cholesterol, but bacterial cell-surface membranes do not.
Suggest why magainin does not damage the frog’s own cells.
(2 marks)
Hint
What does cholesterol do to the phospholipids in a membrane? How would that affect magainin getting into the frog’s membranes?
Mark Scheme
- Cholesterol in the frog’s membranes restricts the movement of the phospholipids, making the membrane more stable (1 mark)
- So magainin can’t enter the frog’s membranes or form channels in them (1 mark)
Also accepted / rejected
Also accepted
- “Less fluid”, “more rigid” or “less flexible” for more stable (point 1)
- Magainin forms fewer channels (point 2)
Not accepted
- Cholesterol making the membrane “stronger” on its own (point 1)
Tips
- Cholesterol restricts the movement of the phospholipids, so the frog’s membranes are more stable than bacterial membranes
- Link this to how magainin works: it can’t get into the frog’s membranes to form channels
- Cholesterol doesn’t simply make the membrane “stronger”
Frogs make a polypeptide called magainin, which attaches to bacteria.
Scientists wanted to see where magainin attaches. They used a monoclonal antibody for magainin with tiny particles of gold attached, and a transmission electron microscope (TEM).
Suggest how the gold-labelled antibody and the TEM allowed them to see where the magainin was.
(3 marks)
Hint
Where does the antibody end up, and why only there? What happens to electrons when they hit gold? Why is a TEM better than an optical microscope for this?
Mark Scheme
Max 3 marks
- The gold is only where the magainin is, because the antibody binds to magainin (1 mark)
- The antibody is complementary to magainin (1 mark)
- Gold scatters (blocks) electrons, so each gold particle shows up as a dark dot on the TEM image (1 mark)
- The TEM has a high resolution, so it can show the tiny gold particles on the bacterial membrane (1 mark)
Also accepted / rejected
Not accepted
- Magainin binding to the antibody’s “active site” (point 2)
Tips
- The antibody binds only to magainin because it is complementary, so the gold marks where the magainin is; antibodies have binding sites, not active sites
- Electrons can’t pass through gold, so the gold shows up as dark dots on the TEM image
- A TEM has a high enough resolution to show particles this small; this isn’t an ELISA test
Complete Table 1 by putting a tick (✓) in each box where the feature is part of a cell cycle involving mitosis, or a cell cycle involving binary fission.
Table 1
| Feature | Mitosis | Binary fission |
|---|---|---|
| Takes place in bacteria | ||
| Results in two cells | ||
| A circular DNA molecule is copied | ||
| Takes place in animal and plant cells | ||
| Results in four cells | ||
| Linear DNA molecules are copied |
(2 marks)
Hint
Which type of cell has circular DNA, and which has linear chromosomes? How many cells does each type of division make?
Mark Scheme
1 mark for each column that is completely correct (2 marks)
| Feature | Mitosis | Binary fission |
|---|---|---|
| Takes place in bacteria | ✓ | |
| Results in two cells | ✓ | ✓ |
| A circular DNA molecule is copied | ✓ | |
| Takes place in animal and plant cells | ✓ | |
| Results in four cells | ||
| Linear DNA molecules are copied | ✓ |
Tips
- Mitosis happens in eukaryotic cells and copies linear DNA; binary fission happens in prokaryotes and copies circular DNA
- Both produce two cells; neither produces four (that’s meiosis), so leave that row empty
An enzyme is found in two species of bacteria, species X and species Y. The two forms of the enzyme catalyse the same reaction, but they have different amino acid sequences. Both are proteins with a quaternary structure.
Define the quaternary structure of a protein.
(1 mark)
Hint
How many polypeptide chains does a protein need to have a quaternary structure?
Mark Scheme
More than one polypeptide chain (1 mark)
Tips
- Quaternary structure means the protein is made of more than one polypeptide chain
An enzyme is found in two species of bacteria, species X and species Y. The two forms of the enzyme catalyse the same reaction, but they have different amino acid sequences. Both are proteins with a quaternary structure.
Explain how two enzymes with different amino acid sequences can catalyse the same reaction.
(2 marks)
Hint
Which part of an enzyme matters for catalysing a reaction? What must be the same about that part in both enzymes?
Mark Scheme
- Each enzyme’s tertiary structure forms an active site with a similar shape, complementary to the same substrate (1 mark)
- So both form enzyme-substrate complexes with that substrate (1 mark)
Also accepted / rejected
Also accepted
- The amino acids in both active sites are the same (point 1)
Not accepted
- “Similar shape” without mentioning tertiary structure (point 1)
Tips
- The rest of each enzyme can fold differently; what matters is that the tertiary structure forms a similar active site. Use the term “tertiary structure”, not just “shape”
- Then say what that allows: both form enzyme-substrate complexes with the same substrate
- Write “tertiary” and “enzyme-substrate” in full
- Don’t explain how the enzymes are made (mutations, base sequences)
An enzyme is found in two species of bacteria, species X and species Y. The two forms of the enzyme catalyse the same reaction, but they have different amino acid sequences. Both are proteins with a quaternary structure.
Scientists measured the amount of product made over time by each enzyme at pH 7.0 and pH 6.0. The control contained boiled enzyme.
Figure 1 shows their results.
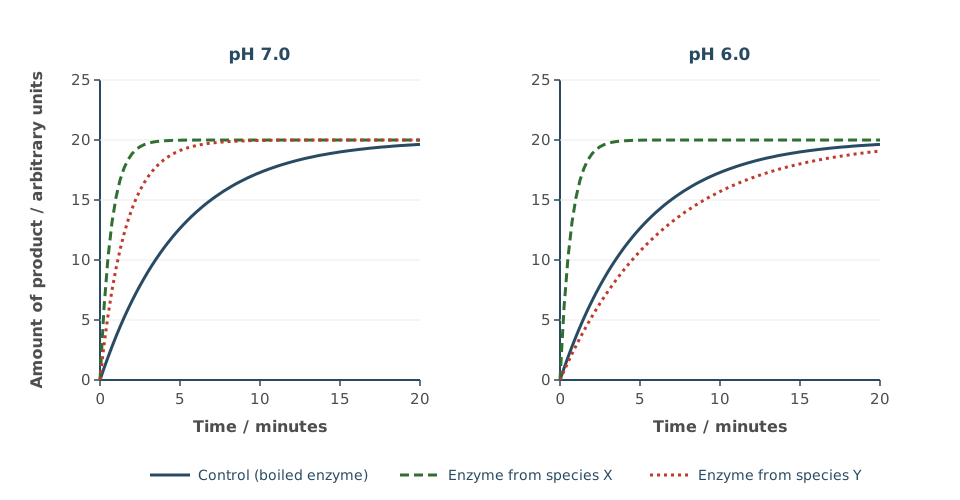
Give three conclusions you can make from Figure 1.
(3 marks)
Hint
Compare each line with the control. Which enzymes make product faster than the control at each pH? What happens in the control? Where do all the lines end?
Mark Scheme
Max 3 marks
- Both enzymes are active at pH 7.0 (1 mark)
- The enzyme from X is equally active at both pHs (not affected by pH) (1 mark)
- The enzyme from Y is not active at pH 6.0 (no faster than the control) (1 mark)
- The reaction happens without an enzyme (product forms in the control) (1 mark)
- All the lines reach the same end point (1 mark)
Also accepted / rejected
Also accepted
- “Y is affected by pH” or “Y is less active than X at both pHs” (point 2)
- “Y is denatured at pH 6.0” (point 3)
Tips
- Compare each line with the control: the faster the product forms, the more active the enzyme
- Say “active” or “catalyses the reaction”, not “works well”
- Don’t forget the control: product still forms without enzyme, and all lines end at the same point
Scientists measured the rate of transpiration of a cotton plant during the middle of the day.
Figure 1 shows their results.
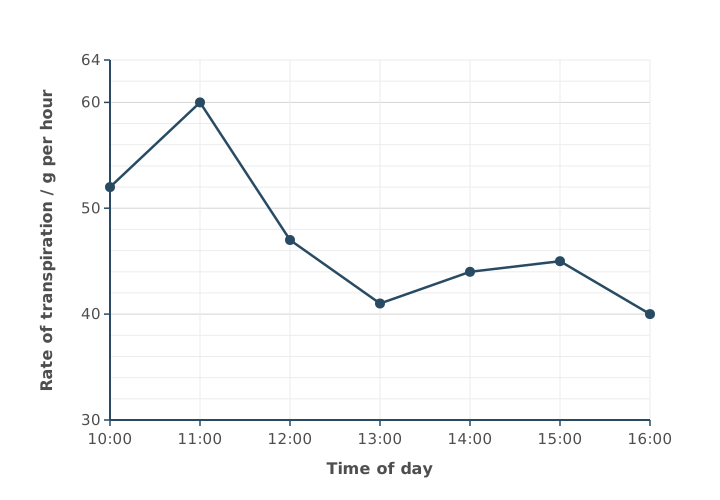
Use Figure 1 to calculate the percentage increase in the rate of transpiration between 13:00 and 14:00.
Answer = ________ %
(2 marks)
Hint
Read both rates carefully from the grid. Percentage change = change ÷ starting value × 100.
Mark Scheme
7.3% (2 marks)
Working:
- Increase: 44 − 41 = 3 g per hour
- Percentage increase: 3 ÷ 41 × 100 = 7.3%
If the answer is wrong, 1 mark for any of:
- 3 (the increase)
- 6.8 (dividing by 44 instead of 41)
- the right digits with the decimal point in the wrong place, e.g. 73.2 or 0.073
Also accepted / rejected
Also accepted
- 7 or 7.32
Tips
- Read the rates: 41 g per hour at 13:00 and 44 at 14:00
- Divide the change by the starting value: 3 ÷ 41 × 100 = 7.3%; dividing by 44 gives the wrong answer
Scientists looked at a thin section of human lung tissue with an optical microscope. They used two stains. The first stain binds to DNA. A second stain was needed to stain the red blood cells in the capillaries.
Explain why a second stain was needed for the red blood cells, and suggest which molecule in the red blood cells it could bind to.
(2 marks)
Hint
What do mammalian red blood cells lack that most other cells have? What do red blood cells contain lots of?
Mark Scheme
- Red blood cells have no nucleus (no DNA), so the first stain doesn’t stain them (1 mark)
- Haemoglobin (1 mark)
Also accepted / rejected
Not accepted
- Iron (it’s an ion, not a molecule) (point 2)
Tips
- Mammalian red blood cells have no nucleus, so a DNA stain can’t show them
- The stain could bind to haemoglobin; iron is an ion, not a molecule
- Red blood cells aren’t too small to see with an optical microscope
In some lung diseases, cells in the walls of the alveoli divide in an uncontrolled way.
Figure 1 shows the wall between the air in an alveolus and a capillary, in a healthy lung and in a damaged lung.
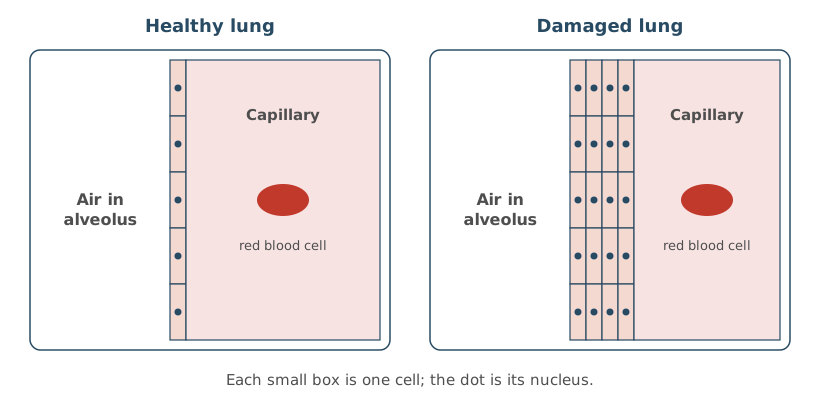
Other than surface area to volume ratio, describe one way the damaged lung is different, as shown in Figure 1, and explain how this would affect gas exchange.
(3 marks)
Hint
Count the layers of cells between the air and the blood. What does that do to the distance gases must travel?
Mark Scheme
Difference
- The alveolar wall is thicker (there are more layers of cells between the air in the alveolus and the blood in the capillary) (1 mark)
Effect on gas exchange
- A longer diffusion pathway (1 mark)
- So slower diffusion of oxygen into the blood (and carbon dioxide out) (1 mark)
Also accepted / rejected
Also accepted
- “Slower gas exchange” (point 3)
Not accepted
- “Less gas exchange” without saying slower (point 3)
Tips
- Be specific about the difference: the wall between the air and the blood is thicker, with more layers of cells
- This gives a longer diffusion pathway, so diffusion is slower; say “slower”, not “less”
A fish has a single circulation. This means that the blood passes through the heart once on each circuit, going from the heart to the gills and then straight on to the rest of the body. A mammal has a double circulation.
Describe two differences between the circulation of blood in a fish and in a mammal.
(2 marks)
Hint
What does “double circulation” mean for how many times blood passes through a mammal’s heart? Where does a mammal’s blood go after the lungs? How many chambers does a mammal’s heart have?
Mark Scheme
Any two, 1 mark each (2 marks)
- In a mammal, blood passes through the heart twice on each circuit; in a fish, only once (1 mark)
- In a mammal, blood returns to the heart after the lungs; in a fish, it goes from the gills straight to the body (1 mark)
- In a mammal, blood reaches the body at higher pressure; in a fish, at lower pressure (1 mark)
- A mammal heart has four chambers; a fish heart has two (one atrium, one ventricle) (1 mark)
Also accepted / rejected
Not accepted
- “Mammals have a double circulation and fish a single one” (that’s given in the question)
- Lungs versus gills on its own (that’s a difference in gas exchange, not circulation)
Tips
- Explain what single and double circulation mean, rather than repeating the words from the question
- Use what you know about mammals: blood returns to the heart after the lungs and is pumped again, so it reaches the body at a higher pressure
- Gills versus lungs is a difference in gas exchange, not in circulation
Complete the passage by writing the correct biological term or number for each numbered gap.
In a muscle cell, glucose is first broken down by glycolysis. This takes place in the (1) of the cell and does not need oxygen. Glucose is converted to glucose phosphate by (2), using ATP. Glucose phosphate is then split to form two triose phosphate molecules. Each triose phosphate is oxidised to (3). Overall, this gives a net gain of (4) ATP molecules per glucose and produces reduced (5).
(2 marks)
Hint
Where in the cell does glycolysis happen? What is adding a phosphate group called? What is the end product of glycolysis? How many ATP are used and how many are made? Which coenzyme is reduced in respiration?
Mark Scheme
All 5 correct = 2 marks; 3 or 4 correct = 1 mark
- Cytoplasm
- Phosphorylation
- Pyruvate
- 2
- NAD
Also accepted / rejected
Also accepted
- Pyruvic acid (3)
- NADH or NADH₂ (5)
Not accepted
- Substrate-level or oxidative phosphorylation (2)
- 4 (4, as that’s the number made, not the net gain)
- NADP (5)
Tips
- Glycolysis happens in the cytoplasm, not the mitochondrion
- “Phosphorylation” is the biological term for adding phosphate; “converted” isn’t a biological term
- Triose phosphate is oxidised to pyruvate, not to lactate or glycerate phosphate
- 4 ATP are made but 2 are used to phosphorylate glucose, so the net gain is 2
- NAD is the coenzyme in respiration; NADP is used in photosynthesis
Cyanide inhibits the electron transfer chain. Scientists added cyanide to respiring root tissue from pea seedlings. They found that:
- oxygen uptake decreased
- ATP production decreased
- the tissue started to produce ethanol.
Explain each of these three changes.
(3 marks)
Hint
What is oxygen’s role at the end of the chain? Where does most ATP come from in aerobic respiration? What do plant cells make when they respire anaerobically?
Mark Scheme
Oxygen uptake decreased
- Oxygen is the final electron acceptor at the end of the chain, so less is needed (1 mark)
Explanation (not marked): Cyanide stops electrons moving along the chain, so they no longer reach the end. Oxygen normally accepts these electrons and combines with H⁺ ions to form water. If no electrons reach the end of the chain, the oxygen is not needed, so oxygen uptake decreases.
ATP production decreased
- Less oxidative phosphorylation (fewer H⁺ ions pumped, so less chemiosmosis) (1 mark)
Ethanol produced
- Anaerobic respiration takes place. Pyruvate is reduced to ethanol (1 mark)
Also accepted / rejected
Also accepted
- Points 1 and 2 given under either of the first two headings
Not accepted
- Lactate or lactic acid (point 3, as plants make ethanol)
Tips
- Oxygen uptake falls because oxygen is the final electron acceptor; less is needed when the chain is blocked
- Link less ATP to less oxidative phosphorylation (less chemiosmosis), not just “fewer electrons move”
- Plant cells make ethanol, not lactate, when they respire anaerobically; pyruvate is reduced, not oxidised
Explain what is meant by homeostasis.
(1 mark)
Hint
What does homeostasis keep stable, and how much is it allowed to change?
Mark Scheme
Maintaining a stable internal environment within restricted limits (1 mark)
Also accepted / rejected
Also accepted
- “Within narrow limits”, or “keeping internal conditions constant”
Tips
- Homeostasis is keeping the internal environment within restricted limits, using physiological control systems
- Say “internal environment”; “keeping the body the same” is too vague
Adrenaline binds to receptors on liver cells and raises the blood glucose concentration.
Which of these is not a result of adrenaline binding to liver cells?
Tick (✓) one box.
Hint
Follow the second messenger model step by step. Does adrenaline make liver cells store glucose or release it?
Mark Scheme
D: Glycogenesis (1 mark)
Tips
- Read the question carefully, as it asks which is NOT a result
- Adrenaline activates adenylate cyclase, which makes cyclic AMP from ATP; cyclic AMP activates protein kinase, which leads to glycogenolysis (glycogen to glucose), not glycogenesis
Haemophilia B is an inherited disorder in which blood does not clot properly, because of a faulty gene for the protein factor IX. It is usually treated with regular injections of factor IX.
Scientists tested a gene therapy for haemophilia B. It uses a virus as a vector to deliver DNA coding for factor IX to liver cells.
The scientists:
- chose 54 men, aged 18 to 75, with moderate or severe haemophilia B
- recorded the number of bleeding episodes each man had per year while on factor IX injections
- gave each man one injection of the gene therapy, then recorded his bleeding episodes per year for the next two years.
Table 1
| Treatment | Mean number of bleeding episodes per year (± 2 × SD) |
|---|---|
| Before: regular factor IX injections | 4.2 ± 0.8 |
| After: one injection of gene therapy | 1.1 ± 1.4 |
The mean ± 2 × SD includes over 95% of the data.
Use all the information to evaluate this gene therapy as a treatment for haemophilia B.
(5 marks)
Hint
Work out each range (mean ± 2 SD). Do they overlap? Then think about who was in the study, and what a single treatment means for patients.
Mark Scheme
Max 5 marks. Point 1 is needed for full marks, and no more than 3 marks can come from points 4 to 7.
For
- The ranges (± 2 SD) don’t overlap, so the difference is significant (1 mark)
- Only one injection is needed, instead of regular injections (1 mark)
- The same men were compared before and after (1 mark)
Against
- Only men were studied (1 mark)
- There may be side effects (e.g. from the viral vector) (1 mark)
- No one under 18 was studied (1 mark)
- Only moderate or severe haemophilia B was studied (1 mark)
Also accepted / rejected
Also accepted
- “Not due to chance” for significant (point 1)
- Children for under 18 (point 6)
Not accepted
- “The results are significant” (point 1, as it’s the difference that is significant)
Tips
- Use the ranges. 3.4 to 5.0 and −0.3 to 2.5 don’t overlap, so the difference in bleeding episodes is significant
- One injection is a real advantage over regular injections
- The same men were compared before and after, so there was a comparison
- Points against include only men, only adults, only moderate or severe cases, and possible side effects
- Comments about sample size or the length of the study don’t score
In multiple sclerosis (MS), the myelin sheaths around some neurones in the brain and spinal cord are destroyed. People with MS can have slower reflexes.
Explain why.
(3 marks)
Hint
What does myelin normally allow an impulse to do? What happens to the speed of the impulse without it, and which neurones in a reflex are affected?
Mark Scheme
- No saltatory conduction, so depolarisation happens along the whole length of the axon instead of jumping from node to node (1 mark)
- So nerve impulses are slower (1 mark)
- This affects the relay neurones in the brain or spinal cord, or transmission to the motor neurones and the effector (1 mark)
Also accepted / rejected
Also accepted
- “Action potentials” for impulses (points 1 and 2)
- “Impulses take longer to travel” (point 2)
Tips
- Slower reflexes means slower impulses. Explain why. Without myelin there’s no saltatory conduction, so depolarisation happens along the whole axon
- Myelin insulates the axon and speeds impulses up
- Link it to the reflex arc, which involves relay neurones, motor neurones and an effector
The parasympathetic nervous system releases acetylcholine at its synapses. Glycopyrronium is a drug that binds to acetylcholine receptors without stimulating them.
Glycopyrronium can be given to patients whose heart rate is too slow.
Use this information to explain how glycopyrronium increases the heart rate.
(3 marks)
Hint
What can’t acetylcholine do if glycopyrronium is on its receptors? What does the parasympathetic system normally do to the heart, and which part of the heart controls the rate?
Mark Scheme
- Less acetylcholine binds to its receptors (1 mark)
- So there is less inhibition of the heart by the parasympathetic system (fewer impulses) (1 mark)
- Mentions the sinoatrial node (SAN) (1 mark)
Explanation (not marked): Normally, neurones of the parasympathetic nervous system release acetylcholine at the sinoatrial node (SAN). Acetylcholine binds to receptors on the SAN and slows the rate at which it sends out waves of electrical activity, so the heart beats more slowly. Glycopyrronium sits on these receptors, so acetylcholine can’t bind. The slowing effect is removed, so the SAN sends out waves of electrical activity more often and the heart rate increases.
Also accepted / rejected
Not accepted
- Glycopyrronium acting as a competitive inhibitor of an enzyme’s active site (point 1, as these are receptors)
Tips
- Start with binding. Glycopyrronium sits on the receptors, so less acetylcholine binds
- The parasympathetic system normally slows the heart, so blocking it means less inhibition and a faster rate
- Name the sinoatrial node (SAN); it’s a mark point that’s often missed
For very overweight patients, some drug doses are worked out from lean body weight (LBW). For women, LBW can be estimated with this equation:
LBW = 9.27 × 10³ × TBW(8.78 × 10³) + (244 × BMI)
where TBW = total body weight in kg and BMI = body mass index.
A suggested dose of a drug is 0.004 mg per kg of LBW.
Calculate the dose, in mg, for a woman whose TBW is 98.4 kg and whose BMI is 38.
Give your answer to 3 significant figures. Show your working.
Answer = ________ mg
(2 marks)
Hint
Work out the bottom of the fraction first (multiply before adding). Then find LBW, multiply by the dose per kg, and check the significant figures.
Mark Scheme
0.202 mg (2 marks)
Working:
- Top of the fraction: 9.27 × 10³ × 98.4 = 912 168
- Bottom of the fraction: (8.78 × 10³) + (244 × 38) = 8780 + 9272 = 18 052
- LBW (top ÷ bottom): 912 168 ÷ 18 052 = 50.53 kg
- Dose: 50.53 × 0.004 = 0.202 mg (3 significant figures)
If the answer is wrong, 1 mark for any of:
- the digits 202 with the decimal point in the wrong place
- 0.2021 (more than 3 significant figures) or 0.20 (fewer)
- 0.203 (incorrect rounding)
- 0.403 (adding 244 and 38 instead of multiplying)
Tips
- Multiply 244 by the BMI before adding it to 8.78 × 10³
- Check the size. LBW is about 50 kg, so the dose is about 0.2 mg
- Give exactly 3 significant figures (0.202)
A student used a choice chamber to investigate how light intensity affects the movement of blowfly larvae (maggots).
The student:
- lined all four sections of the chamber with the same damp filter paper
- covered three sections of the lid with different numbers of layers of black paper, so the sections had 0%, 25%, 50% and 100% light intensity
- placed 40 larvae in the centre of the chamber
- waited 10 minutes, then counted the larvae in each section.
The student said that this method helps to make any conclusions valid.
Suggest and explain three features of the method that support this.
(3 marks)
Hint
For each step, ask yourself what it keeps the same, or what problem it avoids.
Mark Scheme
Max 3 marks
- The same damp filter paper in every section, so light is the only variable (humidity is the same) (1 mark)
- 40 larvae, a large sample, so the results are representative (1 mark)
- Larvae placed in the centre, so they are the same distance from each section (no bias) (1 mark)
- Waiting 10 minutes gives the larvae time to respond and spread out (1 mark)
Also accepted / rejected
Also accepted
- “Reduces the effect of anomalies” (point 2)
- “Time to acclimatise” (point 4)
Not accepted
- “Time to move” on its own (point 4)
Tips
- Explain each feature, don’t just name it. For example, the same damp paper in every section means light is the only thing that varies
- A large sample makes the results representative; it doesn’t make them “accurate”
- Changing the light with black paper is how the independent variable is set, not a validity feature
A student used a choice chamber to investigate how light intensity affects the movement of blowfly larvae (maggots).
Table 1
| Section | Light intensity / % | Number of larvae after 10 minutes |
|---|---|---|
| A | 0 | 21 |
| B | 25 | 10 |
| C | 50 | 6 |
| D | 100 | 3 |
The larvae moved in a particular direction.
Use Table 1 to name the type of behaviour shown, and suggest one advantage of this behaviour to the larvae.
(2 marks)
Hint
Was the movement towards or away from the light? Is a directional movement a taxis or a kinesis? Where would larvae be safer?
Mark Scheme
- Negative phototaxis (1 mark)
- The larvae are less visible to predators (less likely to be eaten), or they avoid heat and drying out (1 mark)
Also accepted / rejected
Also accepted
- “Taxis” on its own (point 1)
Not accepted
- Kinesis or phototropism (point 1)
- “To survive” without saying how (point 2)
Tips
- A directional movement towards or away from a stimulus is a taxis; kinesis is non-directional and tropism is a plant growth response
- The larvae moved away from light, so it’s negative phototaxis
- Give a specific advantage, such as being hidden from predators
A student used a choice chamber to investigate how light intensity affects the movement of blowfly larvae (maggots). She counted the number of larvae in each of four sections, which had 0%, 25%, 50% and 100% light intensity. She then used a chi-squared (χ²) test.
Give a null hypothesis for this investigation, and explain why the χ² test was the right test to use.
(2 marks)
Hint
A null hypothesis says there is no effect or difference. What kind of data are counts in categories?
Mark Scheme
- Null hypothesis: light intensity has no effect on the distribution of the larvae (no difference in the numbers in each section) (1 mark)
- The data are categorical (counts in categories), or the test checks for a difference between observed and expected numbers (1 mark)
Also accepted / rejected
Also accepted
- “The larvae show no preference for any light intensity” (point 1)
Tips
- Make the null hypothesis specific, such as “light intensity has no effect on where the larvae go”
- χ² is used for counts in categories, comparing observed with expected numbers; correlation and comparing means need other tests
A student used a choice chamber to investigate how light intensity affects the movement of blowfly larvae (maggots). She counted the larvae in four sections with different light intensities, and calculated a χ² value of 18.6.
Table 2
| Degrees of freedom | Critical value at P = 0.05 | Critical value at P = 0.01 |
|---|---|---|
| 1 | 3.84 | 6.64 |
| 2 | 5.99 | 9.21 |
| 3 | 7.82 | 11.35 |
| 4 | 9.49 | 13.28 |
Use the χ² value of 18.6 and Table 2 to say what you can conclude from this investigation.
Use the terms probability and chance in your answer.
(4 marks)
Hint
How many categories were there, so how many degrees of freedom? Is 18.6 above or below the critical value? What does that say about chance?
Mark Scheme
Max 4 marks
- 18.6 is greater than the critical value of 7.82 (3 degrees of freedom, P = 0.05) (1 mark)
Explanation (not marked): Degrees of freedom = number of categories − 1. There are four sections, so 4 − 1 = 3 degrees of freedom. The row for 3 degrees of freedom in Table 2 gives a critical value of 7.82 at P = 0.05. - The probability of the difference being due to chance is less than 5% (or less than 1%, as 18.6 > 11.35) (1 mark)
- There is a significant difference in the distribution of the larvae (1 mark)
- Reject the null hypothesis (1 mark)
Also accepted / rejected
Also accepted
- “P < 0.05” for point 2
- If the comparison is the wrong way round, up to 2 marks for correctly linking probability, chance and significance
Not accepted
- “The results are significant” (point 3, as it’s the difference that is significant)
Tips
- Degrees of freedom = number of categories − 1 = 3, so compare 18.6 with 7.82
- Use “less than” with probabilities, as in “the probability of the difference being due to chance is less than 5%”
- Say there is a significant difference, then reject the null hypothesis
Scientists investigated whether the number of repeats of one variable number tandem repeat (VNTR) is linked to the risk of bowel cancer in men.
They compared men with 3, 4 or 5 repeats of the VNTR with men who did not have the VNTR, and calculated an odds ratio for each group. An odds ratio compares the risk in a group with the risk in men without the VNTR:
- an odds ratio above 1 means a higher risk
- an odds ratio below 1 means a lower risk.
Table 1
| Number of VNTR repeats | Odds ratio |
|---|---|
| 3 | 0.71 : 1 |
| 4 | 1.35 : 1 |
| 5 | 1.82 : 1 |
A student concluded that the number of VNTR repeats is linked to the risk of bowel cancer in men.
Evaluate the student’s conclusion.
(4 marks)
Hint
Read each odds ratio against 1. Which numbers of repeats raise the risk and which lower it? Then think about what the data don’t cover.
Mark Scheme
Max 4 marks. Points 1 and 2 are needed for full marks.
- 3 repeats is linked to a lower risk of bowel cancer (1 mark)
- 4 and 5 repeats are linked to a higher risk (1 mark)
- No data for other numbers of repeats (fewer than 3 or more than 5) (1 mark)
- Other factors affect bowel cancer risk, e.g. age or diet (1 mark)
- Bowel cancers are not all the same type (1 mark)
- The sample size is not given (1 mark)
Also accepted / rejected
Also accepted
- “More than three repeats increases the risk” (point 2)
Tips
- Read the odds ratios against 1. Below 1 is a lower risk and above 1 a higher risk, so 3 repeats lowers the risk and 4 and 5 raise it
- Describe both the decrease and the increase for full marks
- Limitations include only three numbers of repeats, other risk factors, different types of bowel cancer, and an unknown sample size (not “small”)
Phenylketonuria (PKU) is a recessive inherited disorder. Table 1 shows the number of people with PKU in one country, and the country’s population, in 2018 and 2023.
Table 1
| Year | Number of people with PKU | Population / millions |
|---|---|---|
| 2018 | 2412 | 48.20 |
| 2023 | 2530 | 48.90 |
Calculate how many more people had PKU in 2023 than expected.
Assume the proportion of the population with PKU stays the same.
Show your working.
Answer = ________ people
(2 marks)
Hint
Use 2018 to find the proportion of people with PKU. Apply it to the 2023 population to find the expected number, then compare.
Mark Scheme
83 people (accept 82 to 83) (2 marks)
Working:
- Proportion with PKU in 2018: 2412 ÷ 48 200 000 = 5.004 × 10⁻⁵
- Expected in 2023: 5.004 × 10⁻⁵ × 48 900 000 = 2447
- Extra people: 2530 − 2447 = 83
If the answer is wrong, 1 mark for any of:
- the digits 5004 (the proportion, with the decimal point anywhere)
- 2447 (the expected number in 2023)
- 1.0145 (the population growth factor)
Tips
- Find the proportion from 2018, then use it on the 2023 population to get the expected number
- Subtract the expected number from the actual number
- You don’t need the Hardy-Weinberg equation here
A recessive disorder is caused by an allele, d, in which six bases of a gene are deleted. The normal allele is D.
Two parents and their two children were tested using DNA probes and gel electrophoresis. One child has the disorder.
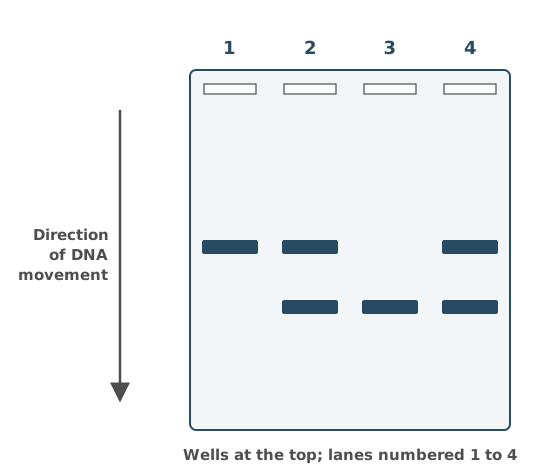
Use Figure 1 to complete Table 1, and explain how you identified the child with the disorder.
Table 1
| Lane | Parent or child | Genotype |
|---|---|---|
| 1 | ||
| 2 | ||
| 3 | ||
| 4 |
(3 marks)
Hint
Each person has two alleles. Which people must carry both D and d? Which allele is shorter, and so travels further through the gel?
Mark Scheme
1 mark for each correct column (2 marks)
| Lane | Parent or child | Genotype |
|---|---|---|
| 1 | Child | DD |
| 2 | Parent | Dd |
| 3 | Child | dd |
| 4 | Parent | Dd |
Explanation (not marked): Shorter DNA travels further through the gel. The d allele is six bases shorter, so it makes the lower band and D makes the higher band.
- Lane 3 has only the lower band, so this child is dd.
- Lane 1 has only the higher band, so this child is DD.
- Lanes 2 and 4 have both bands, so they are Dd. These must be the parents, because the dd child got a d from each parent and the DD child got a D from each.
- Lane 3 has only the d allele, which travels further because it has six fewer bases (shorter) (1 mark)
Also accepted / rejected
Also accepted
- Heterozygous, homozygous dominant and homozygous recessive instead of letters
- Other letters for the alleles
Tips
- The child with the disorder is homozygous recessive (dd), so their lane has only the lower band
- Explain the position. The d allele has six bases deleted, so it’s shorter and travels further
- “It travels further” on its own isn’t enough; say why
Ancient hedgerows in the UK contain many different species of plant. They support a high biodiversity of insect species.
Explain why.
(3 marks)
Hint
How do many plant species help insects? Think about where insects can live and what they can eat.
Mark Scheme
- There are many plant species in the hedgerow (1 mark)
- So there are more habitats or niches (1 mark)
- And a greater variety of food sources (1 mark)
Also accepted / rejected
Not accepted
- “More food” without saying more variety (point 3)
- “Shelter” or “homes” instead of habitats or niches (point 2)
Tips
- Start with the plants, as there are many plant species
- Link this to more habitats or niches, and a greater variety of food
- “More food” on its own doesn’t show why there are more insect species
After a fire, an area of heathland slowly returns to woodland by secondary succession.
Describe the process of secondary succession.
(4 marks)
Hint
Which species arrive first? How do they change the conditions, and who benefits? Where does it end?
Mark Scheme
Max 4 marks
- Pioneer species colonise (1 mark)
- The species change the environment (e.g. adding organic matter to the soil) (1 mark)
- This makes conditions less hostile for new species (1 mark)
- Biodiversity increases (1 mark)
- Until a climax community forms (1 mark)
Also accepted / rejected
Also accepted
- Seeds or spores already present in the soil (point 1)
- Soil already present (point 2)
- Earlier species being outcompeted (point 3)
Tips
- Use the term “pioneer species”
- Say the species change the environment, making it less hostile for new species
- End with increasing biodiversity and a climax community
- Don’t describe natural selection or speciation
Much of lowland England was once covered in woodland. Farming practices now stop most of this land returning to woodland by secondary succession.
Suggest two farming practices that prevent this.
(2 marks)
Hint
What do farmers do to land that stops young trees and shrubs growing?
Mark Scheme
Max 2 marks
- Growing crops (1 mark)
- Grazing animals (1 mark)
- Ploughing (1 mark)
- Using herbicides (or pesticides) (1 mark)
- Burning plants (1 mark)
- Building on the land (e.g. barns) (1 mark)
Also accepted / rejected
Also accepted
- A named crop, or “monoculture” (point 1)
- A named animal, e.g. sheep grazing (point 2)
Tips
- Give practices that stop plants growing back, such as grazing, ploughing, growing crops, herbicides or burning
- Deforestation, planting hedges and using fertilisers don’t answer the question
Figure 1 shows a drawing of a cholinergic synapse between two neurones.
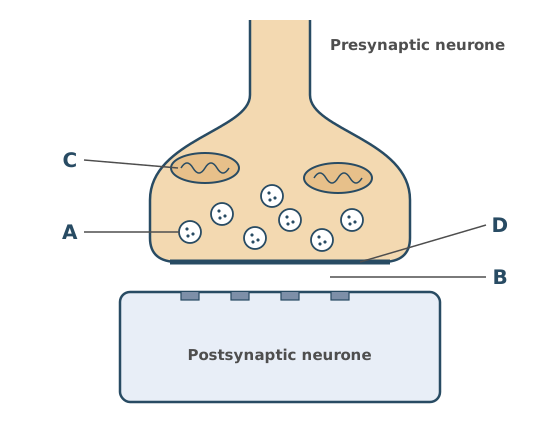
Name the parts labelled A to D.
(2 marks)
Hint
Which structure in the knob holds the neurotransmitter? Which organelle makes most of the ATP? What are the membrane of the knob and the gap next to it called?
Mark Scheme
4 correct = 2 marks; 2 or 3 correct = 1 mark
- A. Synaptic vesicle
- B. Synaptic cleft
- C. Mitochondrion
- D. Presynaptic membrane
Also accepted / rejected
Also accepted
- “Vesicle” on its own (A)
- “Synaptic gap” (B)
- “Mitochondria” (C)
- “Synaptic knob” or “presynaptic neurone” (D)
Not accepted
- “Acetylcholine” or “neurotransmitter” for A (A is the structure that contains it)
- “Synapse” for B (the synapse is the whole junction)
Tips
- A is a vesicle. Name the structure, not what it contains (not acetylcholine, neurotransmitter or calcium ions)
- B is the synaptic cleft (gap), not the “synapse”, which is the whole junction
Figure 1 shows part of a relaxed myofibril from a leg muscle.
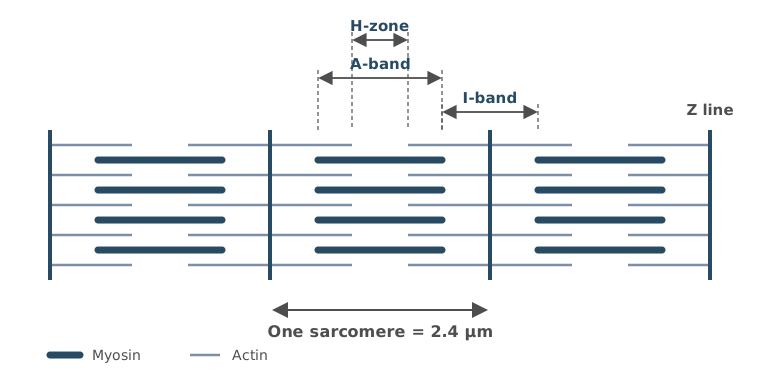
The whole myofibril contains 36 sarcomeres.
When the myofibril contracts, the length of each sarcomere decreases by 25%.
Calculate the length of the myofibril after contraction.
Give your answer in mm and in standard form.
Show your working.
Answer = ________ mm
(2 marks)
Hint
Does each sarcomere get longer or shorter? Find its new length, then multiply by the number of sarcomeres. How many µm are in 1 mm?
Mark Scheme
6.48 × 10⁻² mm (2 marks)
The answer must be in standard form (× 10⁻²) for 2 marks.
Working:
- Length of each sarcomere after contraction: 2.4 × 0.75 = 1.8 µm
- Length of the myofibril: 1.8 × 36 = 64.8 µm
- In mm: 64.8 ÷ 1000 = 0.0648 mm = 6.48 × 10⁻² mm
If the answer is wrong, 1 mark for:
- the digits 648 with the wrong power of ten, or not in standard form
Also accepted / rejected
Also accepted
- 6.5 × 10⁻² mm
Tips
- The sarcomeres contract, so each one gets 25% shorter. Multiply by 0.75; don’t add 25%
- Multiply by the number of sarcomeres, then convert µm to mm by dividing by 1000
- Give the answer in standard form, as the question asks
- The decrease in length isn’t the answer
When a contracted muscle relaxes, the sarcomeres in its myofibrils get longer.
Which describes the changes in a sarcomere when the muscle relaxes?
Tick (✓) one box.
Hint
Which filaments slide, and which band is the length of the myosin filaments?
Mark Scheme
B: A-band stays the same, I-band gets longer, H-zone gets longer (1 mark)
Explanation (not marked): The myosin filaments don’t change length, so the A-band stays the same. When the muscle relaxes, the actin filaments slide back out from between the myosin, so the I-band and the H-zone both get longer.
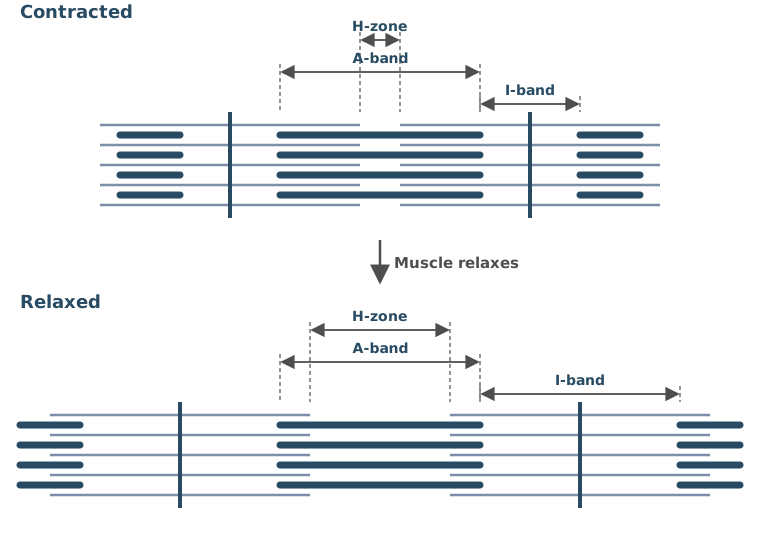
Tips
- The A-band is the length of the myosin filaments, so it doesn’t change
- When a muscle relaxes, the actin filaments slide back out, so the I-band and the H-zone both get longer
A student measured the rate of photosynthesis of a potted geranium plant under filters that let through only red, green or blue light.
Give three environmental factors that the student should keep the same when measuring the rate of photosynthesis.
Do not include features of the plant in your answer.
(2 marks)
Hint
Apart from the colour of the light, what affects the rate of photosynthesis? Think about the light, the air and the surroundings of the plant.
Mark Scheme
3 correct = 2 marks; 2 correct = 1 mark
Any three of:
- Light intensity
- Carbon dioxide concentration
- Temperature
- Water in the soil, or humidity
Also accepted / rejected
Also accepted
- “Distance from the light source” for light intensity
Not accepted
- “Sunlight” for light intensity
Tips
- Name the factors precisely. Write light intensity and carbon dioxide concentration, not the “amount” of light or CO₂
- Soil pH and nutrients aren’t credited, and oxygen concentration or air movement are wrong
Ragwort plants produce large numbers of small seeds.
- The mean mass of one ragwort seed is 0.25 mg.
- One ragwort plant produces a maximum of 120 000 seeds in a growing season.
- 65% of the seeds are still viable (able to germinate) at the end of the growing season.
A farmer estimated that 350 ragwort plants grew on the farm during one growing season.
Calculate the maximum mass, in kg, of viable ragwort seeds on the farm at the end of the growing season.
Assume that all the seeds stay on the farm.
Show your working.
Answer = ________ kg
(2 marks)
Hint
How many seeds do all the plants make, and how many of these are viable? Find their mass, then convert mg to kg.
Mark Scheme
6.83 kg (accept 6.8 or 6.825) (2 marks)
Working:
- Seeds produced: 350 × 120 000 = 42 000 000
- Viable seeds: 42 000 000 × 0.65 = 27 300 000
- Mass: 27 300 000 × 0.25 = 6 825 000 mg
- In kg: 6 825 000 ÷ 1 000 000 = 6.83 kg
If the answer is wrong, 1 mark for any of:
- the digits 6825 or 683 with the decimal point in the wrong place (wrong conversion)
- 0.0195 (the mass for one plant)
- 10.5 (not using the 65%)
- 2.73 × 10⁷ (the number of viable seeds)
- 5.69 × 10⁻⁵ (not multiplying by 120 000)
Tips
- Use every value. Multiply the number of plants, the seeds per plant, the proportion that are viable (0.65) and the mass of one seed
- Convert mg to kg at the end (1 kg = 1 000 000 mg)
- Show your working, so a missing step can still earn a mark
After a heart transplant, the nerves to the new heart are not reconnected. The transplanted heart still beats regularly, because cardiac muscle is myogenic.
Describe how the heartbeat is started and how the contraction of the atria and ventricles is coordinated.
Do not include the autonomic nervous system in your answer.
(5 marks)
Hint
Where does each heartbeat start? Follow the electrical activity across the atria, through the delay and down to the ventricles.
Mark Scheme
The points must be in the right order (1 mark is lost if they are not).
- The SAN sends out a wave of electrical activity (1 mark)
- So the atria contract (at the same time) (1 mark)
- The AVN passes the electrical activity on after a short delay (1 mark)
- It travels through the bundle of His and the Purkyne tissue (1 mark)
- So the ventricles contract (at the same time, from the bottom up) (1 mark)
Also accepted / rejected
Also accepted
- “Wave of depolarisation” or “wave of excitation” for electrical activity (points 1 and 3)
- Purkinje for Purkyne (point 4)
Not accepted
- “Signal” or “message” for electrical activity (points 1 and 3)
Tips
- Include the atria contracting. The SAN sends a wave of electrical activity across the atria, so they contract
- Include the short delay at the AVN before it passes the activity on
- The activity then travels through the bundle of His and Purkyne tissue, so the ventricles contract from the bottom up
- Don’t mix up the SAN and AVN, and leave out the autonomic nervous system
What earns marks
- Electrical activity leaving the SAN and passing to the AVN
Atrial fibrillation (AF) is a condition in which the atria contract irregularly, so the heart rate is irregular.
Scientists followed a large group of adults and recorded who developed AF. For each of four factors, they compared people who had the factor with people who did not. They used a statistical test to find out whether the factor was associated with the risk of developing AF.
Table 1 shows the P value for each factor.
Table 1
| Factor | P value for the association with the risk of AF |
|---|---|
| Obesity | 0.002 |
| Drinking more than 3 cups of coffee a day | 0.470 |
| Sleep apnoea (breathing stops briefly during sleep) | 0.038 |
| Heavy alcohol drinking | 0.009 |
What can you conclude from Table 1?
(3 marks)
Hint
Which P values are below 0.05? What does a smaller P value tell you? What does a large P value mean?
Mark Scheme
Max 3 marks
- Obesity, heavy alcohol drinking and sleep apnoea are significantly associated with the risk of AF (P < 0.05) (1 mark)
- Obesity has the most significant association (lowest P value), or sleep apnoea has the least significant of these three (1 mark)
- Coffee drinking is not significantly associated with the risk of AF (P > 0.05) (1 mark)
- Reject the null hypothesis for obesity, alcohol and sleep apnoea, or accept it for coffee (1 mark)
Also accepted / rejected
Also accepted
- A higher risk of AF for significant (point 1)
- “Not due to chance” for significant (points 1 and 2)
- “Due to chance” for not significant (point 3)
Not accepted
- “The results are significant” (points 1 to 3, as it’s the association that is significant)
Tips
- A P value below 0.05 means a significant association. A high P value means it isn’t significant, so don’t read a high P value as a high risk
- So obesity, heavy alcohol drinking and sleep apnoea are significant risk factors, and coffee drinking is not
- Say the association (or difference) is significant, not “the results are significant”
What earns marks
- Spotting the most significant association (the lowest P value)
Scientists inserted the gene for green fluorescent protein (GFP), from a jellyfish, into a bacterial plasmid.
Describe how a restriction endonuclease and DNA ligase are used to insert the gene into the plasmid.
(2 marks)
Hint
What has to happen to the plasmid before the gene can go in? Which bonds have to form to seal the gene into the plasmid?
Mark Scheme
- The restriction endonuclease cuts the plasmid, or it produces sticky ends (1 mark)
- DNA ligase joins the gene and the plasmid, or it forms phosphodiester bonds (1 mark)
Also accepted / rejected
Also accepted
- “Ligase joins the sticky ends” (point 2)
Tips
- The restriction endonuclease cuts the plasmid and leaves sticky ends
- DNA ligase joins the gene and the plasmid by forming phosphodiester bonds. Ligase doesn’t cut DNA or make sticky ends
IAA is a plant growth factor. It activates enzymes that loosen the cell wall, so the wall can be stretched permanently. This ability to stretch permanently is called cell wall plasticity.
Scientists placed segments cut from oat coleoptiles (young shoots) in different concentrations of IAA. They measured the cell wall plasticity and the mean growth of the segments.
Table 1
| IAA concentration / mol dm⁻³ | Cell wall plasticity / arbitrary units | Mean growth of segments / mm |
|---|---|---|
| 10⁻⁹ | 1.4 | 0.8 |
| 10⁻⁸ | 2.1 | 1.3 |
| 10⁻⁷ | 4.8 | 3.6 |
| 10⁻⁶ | 6.0 | 4.6 |
Use the information provided to explain the relationship between IAA concentration, cell wall plasticity and the mean growth of the segments.
(2 marks)
Hint
What happens to plasticity as the IAA concentration rises? How does a wall that stretches more help the segment grow?
Mark Scheme
- As IAA concentration increases, cell wall plasticity increases (IAA activates enzymes that loosen the wall) (1 mark)
- Greater plasticity lets the cells elongate (get longer), so the segments grow more (1 mark)
Also accepted / rejected
Also accepted
- “Stretching” for plasticity (points 1 and 2)
Not accepted
- “Elasticity” for plasticity (points 1 and 2)
- “IAA causes cell elongation” without linking it to plasticity (point 2)
Tips
- Read the concentrations carefully. 10⁻⁶ is a higher concentration than 10⁻⁹, so plasticity increases as IAA concentration increases
- Explain how growth happens. Greater plasticity lets the cells elongate; “IAA causes growth” isn’t enough
- Say “plasticity” or “stretching”, not “elasticity”
Scientists placed segments cut from oat coleoptiles (young shoots) in different concentrations of the plant growth factor IAA.
Table 1
| IAA concentration / mol dm⁻³ | Cell wall plasticity / arbitrary units | Mean growth of segments / mm |
|---|---|---|
| 10⁻⁹ | 1.4 | 0.8 |
| 10⁻⁸ | 2.1 | 1.3 |
| 10⁻⁷ | 4.8 | 3.6 |
| 10⁻⁶ | 6.0 | 4.6 |
Calculate the percentage increase in the mean growth of the segments when the IAA concentration was increased from 10⁻⁹ mol dm⁻³ to 10⁻⁶ mol dm⁻³.
Give your answer to 2 significant figures.
Show your working.
Answer = ________ %
(2 marks)
Hint
Which column do you need? Find the increase, divide by the starting value and multiply by 100. Then round to 2 significant figures.
Mark Scheme
480% (2 marks)
Working:
- Increase: 4.6 − 0.8 = 3.8 mm
- Percentage increase: 3.8 ÷ 0.8 × 100 = 475%
- To 2 significant figures: 480%
If the answer is wrong, 1 mark for any of:
- 475 (not given to 2 significant figures)
- 580 or 575 (4.6 ÷ 0.8 × 100, without subtracting first)
- 83 (dividing by 4.6 instead of 0.8)
Tips
- Use the mean growth column, not the cell wall plasticity column
- Percentage increase = (4.6 − 0.8) ÷ 0.8 × 100 = 475%
- Give the answer to 2 significant figures (480%), as asked
Gibberellic acid (GA) is a plant growth factor. A technician had a 10⁻² mol dm⁻³ stock solution of GA and some distilled water.
Describe how the technician could make a 10⁻⁴ mol dm⁻³ solution of GA.
(1 mark)
Hint
How many times weaker is 10⁻⁴ than 10⁻²? What volumes of stock and water would give that dilution?
Mark Scheme
Mix 1 cm³ of the stock with 99 cm³ of distilled water, or make two 1 in 10 dilutions (1 cm³ of solution with 9 cm³ of water, then repeat) (1 mark)
Explanation (not marked): Work out how many times weaker the new solution must be.
- 10⁻² mol dm⁻³ is 0.01 mol dm⁻³, and 10⁻⁴ mol dm⁻³ is 0.0001 mol dm⁻³
- 0.01 ÷ 0.0001 = 100, so the new solution is 100 times weaker (a 100-fold dilution)
- So 1 part stock must be in 100 parts in total, which is 1 cm³ of stock and 99 cm³ of water
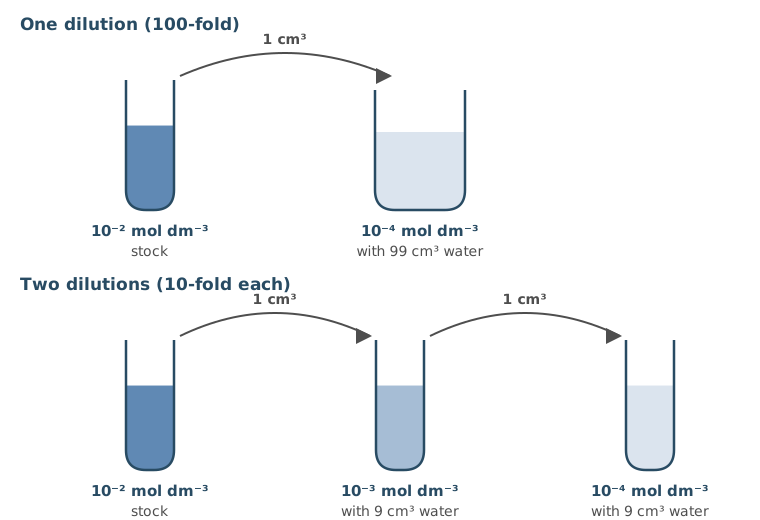
Also accepted / rejected
Also accepted
- Any volumes in the same proportions
Not accepted
- 1 cm³ of stock added to 100 cm³ of water (a 101-fold dilution)
- “Dilute with water” without volumes
Tips
- Give volumes. 1 part stock to 99 parts distilled water makes a 100-fold dilution, or you can do 1 part to 9 parts twice
- 1 cm³ of stock added to 100 cm³ of water is a 101-fold dilution, not 100-fold
A student investigated the effect of the concentration of gibberellic acid (GA) on the growth of pea stem segments. The student was given:
- GA solutions of 10⁻², 10⁻³, 10⁻⁴ and 10⁻⁵ mol dm⁻³
- distilled water
- 5 Petri dishes and other glassware
- 50 pea stem segments of different lengths.
Describe a procedure the student could follow to investigate the effect of GA concentration on the growth of the stem segments.
Include the variables that should be controlled.
(5 marks)
Hint
How many dishes do you need, and what goes in each one? What will you measure, and when? What must be the same in every dish?
Mark Scheme
Max 5 marks. No more than 3 marks can come from points 3 to 8.
Method
- Use distilled water as a control and the four GA concentrations, with 10 segments in each dish (1 mark)
- Measure the length of each segment at the start and at the end, and work out the change in length (1 mark)
Controlled variables
- The same volume of solution in each dish (1 mark)
- The same time (1 mark)
- The same temperature (1 mark)
- Segments from the same species (or the same plant) (1 mark)
- Plants of the same age (1 mark)
- Segments of the same diameter (thickness) (1 mark)
Also accepted / rejected
Also accepted
- Another number of segments per dish with repeats, if all 50 are used (point 1)
- Cutting all the segments to the same length at the start (point 2)
- A named length of time (point 4)
Tips
- Include a control of distilled water and use all 50 segments (10 per dish)
- Measure each segment at the start and the end, and work out the change in length
- Control the volume of solution, time, temperature, species, age and stem diameter. Light, pH and carbon dioxide aren’t credited
- Aseptic technique and nutrient agar aren’t needed here
What earns marks
- Temperature, time and volume of solution are the controlled variables most often given
Type II diabetes is in remission when a person’s blood glucose concentration stays below the level used to diagnose diabetes for at least 3 months, without any diabetes medication.
Scientists investigated whether a low-calorie diet programme could put type II diabetes into remission. The scientists:
- used random numbers to choose 400 volunteers from the patient lists of 60 GP surgeries
- chose volunteers aged 20 to 65 who had been diagnosed with type II diabetes in the last 6 years
- put half the volunteers in diet group D, which followed a low-calorie diet programme for 2 years
- put the other half in control group C, which had their usual care
- recorded each volunteer’s change in mass, and whether their diabetes was in remission, after 2 years.
The design of this study helps to make its conclusions valid.
Suggest and explain three features of the study that support this.
(3 marks)
Hint
For each feature, ask what problem it avoids or what it makes possible. Think about how the volunteers were chosen, how many there were, how long the study lasted and what group D was compared with.
Mark Scheme
Max 3 marks
- Random numbers were used to choose the volunteers, so there was no bias (1 mark)
- A large sample (400), so the results are representative (1 mark)
- It lasted 2 years, so long-term effects could be seen (1 mark)
- There was a control group, so a comparison could be made (1 mark)
- A wide age range (20 to 65), so the results are representative of different ages (1 mark)
Also accepted / rejected
Also accepted
- 60 GP surgeries, or 200 in each group, for a large sample (point 2)
- “Can be generalised” for representative (points 2 and 5)
Tips
- For each feature, explain why it helps. For example, random numbers were used, so there was no bias
- Naming a feature isn’t enough
- Only including people diagnosed in the last 6 years is a limitation, not a strength
Type II diabetes is in remission when a person’s blood glucose concentration stays below the level used to diagnose diabetes for at least 3 months, without any diabetes medication.
Scientists investigated whether a low-calorie diet programme could put type II diabetes into remission. The scientists:
- used random numbers to choose 400 volunteers from the patient lists of 60 GP surgeries
- chose volunteers aged 20 to 65 who had been diagnosed with type II diabetes in the last 6 years
- put half the volunteers in diet group D, which followed a low-calorie diet programme for 2 years
- put the other half in control group C, which had their usual care
- recorded each volunteer’s change in mass, and whether their diabetes was in remission, after 2 years.
Table 1
| Group | In remission / % | Lost 10 kg or more / % | In remission, of those who lost 10 kg or more / % | In remission, of those who gained mass / % |
|---|---|---|---|---|
| D | 36.5 | 24.0 | 64.6 | 2.0 |
| C | 3.5 | 3.0 | 66.7 | 2.5 |
Calculate how many more volunteers were in remission in group D than in group C.
Show your working.
Answer = ________ volunteers
(2 marks)
Hint
How many volunteers were in each group? Turn each percentage into a number of people before you subtract.
Mark Scheme
66 (2 marks)
Working:
- Each group had 400 ÷ 2 = 200 volunteers
- Group D: 36.5% of 200 = 73
- Group C: 3.5% of 200 = 7
- Difference: 73 − 7 = 66
If the answer is wrong, 1 mark for any of:
- 132 (using 400 volunteers in each group)
- 73 or 7 in the working
Tips
- Each group had 200 volunteers (400 split equally), not 400
- Work out numbers, not percentages. 36.5% of 200 is 73 and 3.5% of 200 is 7, so the difference is 66
- Subtracting the percentages (33%) isn’t the answer
Type II diabetes is in remission when a person’s blood glucose concentration stays below the level used to diagnose diabetes for at least 3 months, without any diabetes medication.
Scientists investigated whether a low-calorie diet programme could put type II diabetes into remission. The scientists:
- used random numbers to choose 400 volunteers from the patient lists of 60 GP surgeries
- chose volunteers aged 20 to 65 who had been diagnosed with type II diabetes in the last 6 years
- put half the volunteers in diet group D, which followed a low-calorie diet programme for 2 years
- put the other half in control group C, which had their usual care
- recorded each volunteer’s change in mass, and whether their diabetes was in remission, after 2 years.
Table 1
| Group | In remission / % | Lost 10 kg or more / % | In remission, of those who lost 10 kg or more / % | In remission, of those who gained mass / % |
|---|---|---|---|---|
| D | 36.5 | 24.0 | 64.6 | 2.0 |
| C | 3.5 | 3.0 | 66.7 | 2.5 |
Use all the information to evaluate whether this diet programme is an effective treatment for type II diabetes.
(4 marks)
Hint
What do the two groups’ results show? Then think about who wasn’t in the study, what remission means and which test is missing.
Mark Scheme
Max 4 marks. No more than 3 marks can come from points 5 to 9.
From the data
- A higher percentage of group D were in remission and lost 10 kg or more than in group C (1 mark)
- Most people who lost 10 kg or more were in remission, in both groups (1 mark)
- Some people who gained mass were also in remission (1 mark)
- Less than half of group D were in remission (1 mark)
Limitations
- Only people diagnosed in the last 6 years were included (1 mark)
- No one over 65 (or under 20) was included (1 mark)
- No statistical test, so we don’t know if the difference is significant (1 mark)
- Remission is not a cure (it may not last) (1 mark)
- The volunteers’ starting mass isn’t known (1 mark)
Also accepted / rejected
Also accepted
- Values from Table 1 for “higher” (points 1 and 2)
- “The difference may be due to chance” (point 7)
Not accepted
- “Only 36.5%” without saying it is low or less than half (point 4)
- “To see if the results are significant” (point 7, as it’s the difference that is significant)
Tips
- Use all the information, not just Table 1. Only people aged 20 to 65 who were diagnosed in the last 6 years were studied, and remission isn’t a cure
- Give both parts of the comparison, higher remission and more weight loss in group D
- Note that less than half of group D were in remission
- Say a statistical test is needed to see if the difference is significant, not “if the results are significant”
In a small crater lake, a single species of cichlid fish shows phenotypic diversity. Some of the fish are slim with large eyes, and others are deep-bodied with strong jaws.
Suggest three factors that have caused this phenotypic diversity.
(3 marks)
Hint
Where do new alleles come from? What happens in meiosis and fertilisation that makes offspring different? Could their surroundings play a part?
Mark Scheme
Max 3 marks
- Mutations, which produce new alleles (1 mark)
- The environment (e.g. feeding in the open water or on the lake floor), or natural selection (1 mark)
- Epigenetics, where the environment changes gene expression (1 mark)
- Crossing over between homologous chromosomes in prophase I of meiosis (1 mark)
- Independent segregation of homologous chromosomes in meiosis I (1 mark)
- Random fertilisation of gametes (1 mark)
Also accepted / rejected
Also accepted
- Named parts of the habitat, e.g. open water and the lake floor (point 2)
- A selection pressure, e.g. predation (point 2)
- Recombination (point 4)
- Random assortment (point 5)
Tips
- Give three different factors, such as mutation, environment and crossing over. Two versions of the same point only score once
- Isolation, speciation, evolution and food availability don’t cause variation within a population
What earns marks
- Mutations, environment or selection, random fertilisation and crossing over
In a crater lake, some cichlid fish feed on small animals in the open water during the day. These fish can change the shade of their skin from pale to dark within minutes.
Explain why this ability is an advantage to these fish.
(2 marks)
Hint
What happens when an animal matches its background? Who would then find the fish harder to see?
Mark Scheme
- It provides camouflage (the fish blend in with the background) (1 mark)
- So they are less likely to be seen by predators, or they are more likely to catch prey (1 mark)
Also accepted / rejected
Also accepted
- “Fewer are eaten” for less likely to be seen by predators (point 2)
Tips
- Say it provides camouflage (blending in). “Hiding” on its own isn’t enough
- Link it to predators or prey. The fish are less likely to be seen by predators, or more likely to catch prey
Read the passage.
In a small crater lake in Central America, a single species of cichlid fish shows phenotypic diversity. Scientists investigated whether disruptive selection was leading to sympatric speciation in this fish.
Some of the fish are slim, with large eyes. They feed on small animals in the open water near the surface, mainly in daylight. These open-water fish can change the shade of their skin from pale to dark within minutes. Other fish are deep-bodied, with strong jaws. They feed on snails on the dark, rocky lake floor, mainly at dusk and at night.
The scientists compared the mitochondrial genes of the fish. The open-water fish formed a distinct genetic group, but all the fish in the lake were confirmed to be the same species.
The scientists concluded that disruptive selection was probably leading to sympatric speciation in this fish.
Use the information in the passage to evaluate this conclusion.
(5 marks)
Hint
What in the passage fits sympatric speciation, and what fits a different explanation? Have the fish actually become separate species yet?
Mark Scheme
Max 5 marks. Point 1 is needed for full marks.
Supports
- The fish live in the same lake, so there is no geographical isolation (1 mark)
- Feeding in different places at different times could lead to separate gene pools (reproductive isolation) (1 mark)
- Mutations could have produced the different forms (1 mark)
- There is selection for both extremes (slim and deep-bodied), so disruptive selection is occurring (1 mark)
- The open-water fish form a distinct genetic group (1 mark)
Against
- The open water and the lake floor are different areas, so this could be allopatric (geographical isolation) (1 mark)
- The fish are still the same species (1 mark)
Also accepted / rejected
Also accepted
- “No gene flow” or “can’t interbreed” for separate gene pools (point 2)
- “Selection against the intermediate form” (point 4)
- The deep-bodied fish for the open-water fish (point 5)
Not accepted
- Mutations that happen in order to adapt, or that are caused by selection (point 3)
Tips
- Support the conclusion from the passage. The fish live in the same lake, selection favours two extreme forms, and the open-water fish form a distinct genetic group
- Then give points against. The fish are still one species, and the open water and the lake floor could act like separate areas
- Mutations are random. Fish don’t “mutate to adapt”
- Sample size, repeats and statistical tests aren’t relevant here
What earns marks
- Reproductive isolation (no gene flow) and disruptive selection are the points most often credited
Scientists used the mark-release-recapture method to estimate the size of the population of cichlid fish in a crater lake.
Describe and explain two precautions the scientists should take so that their estimate is valid, and give the formula they would use to estimate the population size.
(3 marks)
Hint
What could go wrong with the mark itself? What must happen between release and recapture? Which three numbers go into the formula?
Mark Scheme
Max 3 marks. No more than 2 marks can come from points 1 to 3.
Precautions
- The mark must not harm the fish or make them more visible to predators, or it must not come off, so marked fish can be identified when recaptured (1 mark)
- Leave time after release so the marked fish can spread back through the population (1 mark)
- Catch large samples, so they are representative of the population (1 mark)
Formula
- Population = number in first sample × number in second samplenumber marked in second sample (1 mark)
Also accepted / rejected
Also accepted
- Any correct form of the formula (point 4)
Tips
- Explain each precaution. The mark must not harm the fish or make them easier for predators to see, and it must not come off before recapture
- Leave time after release for the marked fish to spread through the population
- Large samples make the estimate more representative
- Population = number in first sample × number in second sample ÷ number marked in the second sample. Multiply, don’t subtract
A student separated the pigments in a leaf extract by thin-layer chromatography. With solvent X, she saw four spots. She repeated it with the same extract and solvent Y, and saw five spots.
Explain why the two solvents gave different numbers of spots.
(2 marks)
Hint
What property of a pigment decides how far it travels in a solvent? Could one spot in solvent X contain more than one pigment?
Mark Scheme
- Two pigments have the same solubility in solvent X, so they travel the same distance and form one spot (1 mark)
- In solvent Y, these pigments have different solubilities, so they travel different distances and separate into two spots (1 mark)
Writing “solution” instead of “solvent” loses 1 mark.
Explanation (not marked): How far each pigment moves up the plate depends on how soluble it is in the solvent. A pigment that is more soluble travels further with the solvent. (The spots are different colours because each pigment has its own colour.)
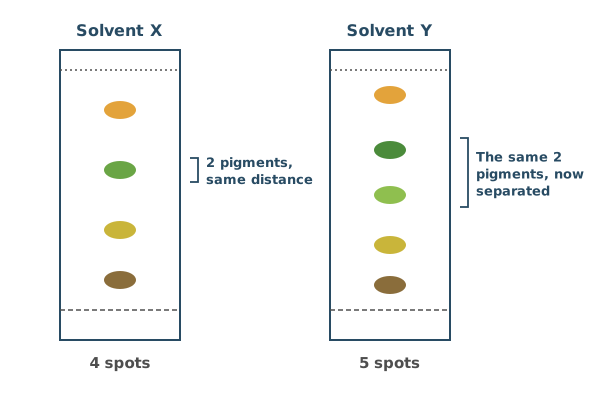
Also accepted / rejected
Also accepted
- “Dissolves” for soluble
- Different Rf values in the two solvents (points 1 and 2)
- “The pigments have different solubilities in solvents X and Y” (both marks)
Tips
- Explain using solubility. The pigments have different solubilities in solvents X and Y
- Write about solubility in the solvents, not “in solutions”
- Saying solvent Y is “stronger” or “more concentrated” doesn’t explain it
Pregabalin is a pain-relief drug that is taken as a capsule. Drug K is a polypeptide that also reduces pain by acting on synapses in the spinal cord. Drug K can’t be given as a capsule, so it is injected into the fluid that surrounds the spinal cord.
Suggest two reasons why drug K is injected into this fluid rather than taken as a capsule.
(2 marks)
Hint
What happens to proteins in the stomach and small intestine? Could a large molecule be absorbed into the blood? How far would the drug have to travel from the gut?
Mark Scheme
- It reaches the spinal cord (the synapses) quickly (1 mark)
- If swallowed, it would be broken down by proteases or acid, or it is too large to be absorbed (1 mark)
Also accepted / rejected
Also accepted
- “Denatured by stomach acid” (point 2)
- “Can’t cross the wall of the ileum” for not absorbed (point 2)
Not accepted
- “Reaches the brain” on its own (point 1)
- Broken down by enzymes that don’t digest proteins, e.g. amylase (point 2)
Tips
- Say what would happen to a capsule. The polypeptide would be broken down by proteases or acid, or is too large to be absorbed
- For the injection, say it reaches the spinal cord (or the synapses) quickly. “Quicker” on its own isn’t enough
Drug K is given to a patient continuously at a rate of 2.4 ng per kg of body mass per hour (2.4 ng kg⁻¹ h⁻¹) for 7 days.
1 ng = 1 × 10⁻⁹ g and 1 µg = 1 × 10⁻⁶ g
Calculate the total mass of drug K, in µg, given to a patient with a body mass of 65 kg.
Show your working.
Answer = ________ µg
(2 marks)
Hint
How many hours are there in 7 days? Multiply the rate by the body mass and the number of hours, then convert ng to µg.
Mark Scheme
26.2 µg (accept 26) (2 marks)
Working:
- Hours in 7 days: 7 × 24 = 168 h
- Rate for this patient: 2.4 × 65 = 156 ng per hour
- Total: 156 × 168 = 26 208 ng
- In µg: 26 208 ÷ 1000 = 26.2 µg
If the answer is wrong, 1 mark for any of:
- the digits 262 with the wrong power of ten (wrong conversion)
- 1.09 (not multiplied by 24)
- 0.403 (not multiplied by 65)
- 10.9 (not multiplied by 2.4)
- 3.74 (not multiplied by 7)
Tips
- Multiply all the values. The rate is per kg per hour, so multiply by the body mass and by the number of hours (24 for each day)
- Convert ng to µg by dividing by 1000
- Show your working, so a missed step can still earn a mark
In a trial of drug K, patients scored their pain every day on a pain scale that had been tested and shown to be statistically valid. They did not describe their pain in their own words.
Suggest two reasons why the scientists used this pain scale.
(2 marks)
Hint
Would two people describe the same pain in the same way? What do the scientists want to do with the scores afterwards?
Mark Scheme
- Pain is subjective, or people’s pain tolerance varies (1 mark)
- It allows a valid comparison, or shows whether differences are significant (1 mark)
Explanation (not marked): On a validated scale, a score of 6 means the same thing to every patient. So the scores can be compared between patients and over time, and tested with statistics. Descriptions in people’s own words can’t be compared like this.
Also accepted / rejected
Also accepted
- Patients might exaggerate their pain (point 1)
- The differences are not due to chance (point 2)
Not accepted
- “To see if the results are significant” (point 2, as it’s the differences that are significant)
Tips
- Pain is subjective, so pain sensitivity and tolerance vary between people
- A valid scale allows a valid comparison, or shows whether differences are significant. Say the differences are significant, not “the results”
- “Accuracy” or “reliability” on its own doesn’t explain it
Table 1 shows two stores of phosphorus on land, and the percentage of each store that is supplied to the soil each year.
Table 1
| Store | Mass of phosphorus / Tg | Supplied to the soil each year / % |
|---|---|---|
| Plants and animals (by decomposition) | 3.0 × 10³ | 0.04 |
| Rocks (by weathering) | 2.0 × 10¹³ | 8.0 × 10⁻¹¹ |
Calculate the difference between the masses of phosphorus supplied to the soil each year by the two stores.
Give your answer in Tg.
Show your working.
Answer = ________ Tg
(2 marks)
Hint
Turn each percentage into a mass first, remembering to divide by 100. Then find the difference.
Mark Scheme
14.8 Tg (2 marks)
Working:
- From plants and animals: 3.0 × 10³ × 0.04 ÷ 100 = 1.2 Tg
- From rocks: 2.0 × 10¹³ × 8.0 × 10⁻¹¹ ÷ 100 = 16 Tg
- Difference: 16 − 1.2 = 14.8 Tg
If the answer is wrong, 1 mark for any of:
- the digits 148 with the wrong power of ten
- 1.2 or 16 in the working
Tips
- Work out each supply first, dividing each percentage by 100
- Then subtract the smaller from the larger. Don’t add or divide them
Mycorrhizal fungi grow in association with plant roots. Scientists investigated whether a mycorrhizal fungus increases the yield of wheat, in soil that is low in phosphate and in soil with added phosphate.
The scientists:
- planted wheat seeds in a large number of pots of sterilised soil, all in one greenhouse
- added the fungus to half of the pots
- gave a phosphate fertiliser to half of the pots with the fungus and half of the pots without it, and added no phosphate to the rest (low phosphate)
- measured the mean mass of grain per plant after 90 days.
Table 1 shows the results. The values after ± are 2 standard deviations, so the mean ± 2 SD includes over 95% of the data.
Table 1
| Group | Fungus | Phosphate | Mean mass of grain per plant / g |
|---|---|---|---|
| W | No | Low | 2.1 ± 0.4 |
| X | Yes | Low | 3.4 ± 0.3 |
| Y | No | Added | 4.2 ± 0.4 |
| Z | Yes | Added | 4.5 ± 0.4 |
Using all the information, evaluate the use of mycorrhizal fungi to increase wheat yield in soil that is low in phosphate and in soil with added phosphate.
(5 marks)
Hint
Work out each range (mean ± 2 SD). Which pairs overlap, and which don’t? Then think about how the study was set up.
Mark Scheme
Max 5 marks. No more than 3 marks can come from points 5 to 9.
From the data
- With added phosphate, there is no significant difference between Y and Z (without and with the fungus) (1 mark)
- With low phosphate, X is significantly greater than W, so the fungus increases yield (1 mark)
- Z is significantly greater than X, so the fungus doesn’t fully make up for low phosphate (1 mark)
- Overlapping ranges (± 2 SD) show no significant difference, and ranges that don’t overlap show a significant difference (1 mark)
The design
- Only one species of fungus was tested (1 mark)
- Only wheat was tested (1 mark)
- A large sample (many pots) makes the results more reliable (1 mark)
- The soil was sterilised, unlike soil in a real field (1 mark)
- It was done in a greenhouse, not in a field (1 mark)
Explanation (not marked): Work out each range. W is 1.7 to 2.5 g and X is 3.1 to 3.7 g, which don’t overlap. Y is 3.8 to 4.6 g and Z is 4.1 to 4.9 g, which do overlap. X (3.1 to 3.7 g) doesn’t overlap with Y or Z, so even with the fungus, wheat in low-phosphate soil yields less than wheat given phosphate.
Also accepted / rejected
Also accepted
- “Not due to chance” for significant, and “due to chance” for no significant difference (points 1 to 3)
- “Only one crop” for only wheat (point 6)
Not accepted
- “The results are significant” (points 1 to 3, as it’s the difference that is significant)
Tips
- Use the ranges (mean ± 2 SD). No overlap means a significant difference, and overlap means no significant difference
- Compare the right pairs. X is significantly greater than W. Y and Z are not significantly different. Z is significantly greater than X
- Say the difference is significant, not “the results”
- Evaluate the design too, such as only one crop, only one fungus, sterilised soil and a greenhouse instead of a field
In an investigation into whether a mycorrhizal fungus increases wheat yield, every pot was given the same nitrate fertiliser, at the concentration recommended for wheat.
Suggest two reasons why the nitrate fertiliser was given at the recommended concentration.
(2 marks)
Hint
What would happen to the results if some pots had more nitrate than others? Why not give much more than the recommended amount?
Mark Scheme
Max 2 marks
- So the fertiliser is a controlled variable (nitrate is the same in every pot) (1 mark)
- Nitrate affects the growth (yield) of the wheat (1 mark)
- A different concentration would change the water potential of the soil, which affects how much water the roots take up (1 mark)
- To give normal farming conditions (1 mark)
Also accepted / rejected
Not accepted
- “For comparison” on its own (point 1)
Tips
- Say the fertiliser is a controlled variable, so nitrate is the same in every pot. “For comparison” or “a fair test” on its own isn’t enough
- Say how nitrate affects the wheat, such as its growth or yield
- The plants were in pots in a greenhouse, so leaching and eutrophication aren’t relevant
In Labrador retrievers, two genes control coat colour.
- Gene B: the dominant allele B gives black pigment, and the recessive allele b gives brown pigment.
- Gene E: two recessive alleles (ee) stop black or brown pigment forming in the hairs, so dogs that are ee have a yellow coat, whatever alleles of gene B they have. Dogs with at least one dominant allele, E, show the colour from gene B.
Name the type of interaction between these two genes.
(1 mark)
Hint
What do you call it when one gene hides the effect of a different gene?
Mark Scheme
Epistasis (1 mark)
Explanation (not marked): Gene E masks the effect of gene B. In ee dogs, no black or brown pigment forms, so the alleles of gene B can’t show and the coat is yellow.
Tips
- When one gene masks the expression of another, it’s epistasis. It isn’t codominance or epigenetics
In Labrador retrievers, two genes control coat colour.
- Gene B: the dominant allele B gives black pigment, and the recessive allele b gives brown pigment.
- Gene E: two recessive alleles (ee) stop black or brown pigment forming in the hairs, so dogs that are ee have a yellow coat, whatever alleles of gene B they have. Dogs with at least one dominant allele, E, show the colour from gene B.
What colour coat would a Labrador with the genotype bbEe have?
(1 mark)
Hint
Does this dog have at least one E allele? If it does, what colour pigment do its B alleles give?
Mark Scheme
Brown (1 mark)
Explanation (not marked): The dog has one E allele, so its coat shows the colour given by gene B. It is bb, so that colour is brown.
Also accepted / rejected
Also accepted
- “Chocolate”
Tips
- Check gene E first. Any dog with at least one E allele shows the colour given by gene B
- bb gives brown pigment, so bbEe is brown
In Labrador retrievers, dogs with the genotype ee have a yellow coat. Dogs with at least one dominant allele, E, are black or brown.
In one population, 84% of the Labradors were black or brown.
Use the Hardy–Weinberg equation to calculate the frequency of the E allele in this population.
Show your working.
Answer = ________
(2 marks)
Hint
Which genotype can you be sure of from the phenotype? Start with that, find q, then find p.
Mark Scheme
0.6 (2 marks)
Working:
- Yellow dogs (ee): 100 − 84 = 16%, so q² = 0.16
- q = √0.16 = 0.4
- p = 1 − 0.4 = 0.6
If the answer is wrong, 1 mark for any of:
- q² = 0.16 (or 16%)
- 0.4 (the frequency of e, not E)
Also accepted / rejected
Also accepted
- 60% (2 marks)
Tips
- The 84% includes both EE and Ee dogs (p² + 2pq), so start with the yellow dogs, which must be ee
- 16% are ee, so q² = 0.16 and q = 0.4
- The question asks for the E allele, so finish with p = 1 − q = 0.6
Table 1 shows how much light three types of photoreceptor in the human retina absorb at some wavelengths. Each value is a percentage of that photoreceptor’s maximum absorption.
Table 1
| Wavelength / nm | Blue-sensitive | Green-sensitive | Red-sensitive |
|---|---|---|---|
| 450 | 90 | 25 | 10 |
| 500 | 30 | 70 | 45 |
| 550 | 0 | 95 | 90 |
| 610 | 0 | 25 | 65 |
Light with a wavelength of 610 nm is seen as orange.
Use Table 1 to explain how the retina allows us to see this light as orange.
In your answer, include:
- the type of photoreceptor used for colour vision
- why the three types of photoreceptor respond differently to light
- what happens when light of 610 nm reaches the retina.
(3 marks)
Hint
Which photoreceptors give colour vision? At 610 nm, which type absorbs most light, and which absorbs a little?
Mark Scheme
- Colour vision uses cones (1 mark)
- Each type of cone has a different pigment, which absorbs a different range of wavelengths (1 mark)
- At 610 nm, the red-sensitive cones absorb more light (65%) than the green-sensitive cones (25%), or more impulses go to the brain from the red-sensitive cones than from the green-sensitive cones (1 mark)
Explanation (not marked): The colour we see depends on the balance of impulses from the different types of cone, which the brain compares. If red-sensitive and green-sensitive cones are stimulated about equally, we see yellow. If almost only red-sensitive cones are stimulated, we see red. At 610 nm, red-sensitive cones are stimulated a lot (65%) and green-sensitive cones a little (25%), so the brain sees a colour between red and yellow, which is orange.
Also accepted / rejected
Not accepted
- “Red cones” or “green cones” instead of red-sensitive and green-sensitive (points 1 to 3)
- “Signals” or “messages” for impulses (point 3)
Tips
- Colour vision uses cones. Write “red-sensitive” and “green-sensitive”, not “red cones” or “green cones”
- Each type of cone has a different pigment that absorbs a different range of wavelengths. Rods aren’t involved
- Use the data. At 610 nm the red-sensitive cones absorb more light than the green-sensitive cones
- So more impulses go to the brain from the red-sensitive cones. Don’t say the colours “merge”
Which is associated with high visual acuity (seeing fine detail)?
Tick (✓) one box.
Hint
Which photoreceptors give detailed vision? How many of them share one neurone?
Mark Scheme
B: Each cone is connected to its own bipolar neurone, so the brain receives separate impulses from each cone (1 mark)
Explanation (not marked): Because each cone has its own neurone, light hitting two cones close together sends two separate sets of impulses, so the brain can tell the two points apart.
Tips
- High visual acuity comes from each cone connecting to its own bipolar neurone, so the brain gets separate impulses from points close together
- High sensitivity is the opposite. Several rods connect to one neurone, and their generator potentials add up by spatial summation
ADH makes the cells in two parts of the nephron more permeable to water. These cells have ADH receptors in their cell-surface membranes.
Name the two parts of the nephron where these cells are found.
(1 mark)
Hint
Where in the nephron is the final volume of urine adjusted?
Mark Scheme
The collecting duct and the distal convoluted tubule (1 mark, both needed)
Also accepted / rejected
Not accepted
- “DCT” for distal convoluted tubule
Tips
- Name both, the collecting duct and the distal convoluted tubule. It isn’t the loop of Henle or the proximal convoluted tubule
- Write “distal convoluted tubule” in full, because “DCT” isn’t accepted
The ADH receptors on cells of the collecting duct bind ADH, but they don’t bind other hormones, such as insulin or adrenaline.
Suggest and explain why.
(2 marks)
Hint
What decides the shape of a protein receptor? What must be true of a molecule that binds to it?
Mark Scheme
- The receptor has a specific tertiary structure (shape) (1 mark)
- Only ADH has a complementary shape, so only ADH can bind (1 mark)
Also accepted / rejected
Not accepted
- “Active site” or “substrate” (points 1 and 2, as a receptor isn’t an enzyme)
- “Antigen” or “antibody” (point 1)
Tips
- The receptor has a specific tertiary structure, and ADH has a complementary shape
- It’s a receptor, not an enzyme. Don’t mention an active site, a substrate or induced fit
After losing a lot of blood in an accident, a person’s blood pressure falls. Receptors detect this fall, and the person’s pituitary gland releases more ADH.
Give the location of the receptors that detect the fall in blood pressure, and explain how releasing more ADH helps blood pressure to return to normal.
(3 marks)
Hint
Which large blood vessels near the heart have pressure receptors? What does ADH do to water in the nephron, and how does that change the blood?
Mark Scheme
- In the aorta or the carotid arteries (carotid sinus) (1 mark)
- ADH increases the reabsorption of water (1 mark)
- So the blood volume increases, and blood pressure rises back towards normal (1 mark)
Also accepted / rejected
Not accepted
- Reabsorption of glucose or ions as well as water (point 2)
Tips
- The pressure receptors are in the aorta or the carotid arteries, not the hypothalamus (which has osmoreceptors) or the pituitary gland
- ADH increases the reabsorption of water only, not glucose or ions
- Link it to blood volume. More water in the blood increases its volume, so blood pressure rises
- You don’t need to describe aquaporins
Complete the passage by writing the correct biological term for each numbered gap.
All the populations of different species living in the same area at the same time form a (1). Each species has its own (2), which is its role within its habitat. The maximum population size of a species that an ecosystem can support is called its (3) capacity. Population size is affected by both biotic and (4) factors.
(2 marks)
Hint
Each gap is one word. Read the sentence around each gap. What is that sentence describing?
Mark Scheme
4 correct = 2 marks; 2 or 3 correct = 1 mark
- Community
- Niche
- Carrying
- Abiotic
Also accepted / rejected
Also accepted
- “Non-living” or “physical” for abiotic (4)
Tips
- (1) community, not population
- (2) niche, not habitat
- (3) carrying capacity, not “maximum” capacity
- (4) abiotic
Forests, such as tropical rainforests and mangrove forests, are being cleared in many parts of the world.
Suggest two reasons for conserving forests.
(2 marks)
Hint
Think about the living things found in forests, the gases the trees exchange, what people use forests for, and what the roots do to the soil.
Mark Scheme
Max 2 marks
- To conserve species (biodiversity) (1 mark)
- To conserve habitats or niches (1 mark)
- They take up carbon dioxide, which reduces climate change (1 mark)
- A source of food, wood or medicines (1 mark)
- They reduce erosion of the soil or the coast (1 mark)
- Tourism (1 mark)
Also accepted / rejected
Also accepted
- Protecting the land and way of life of local communities (point 2)
- “Reduces global warming” (point 3)
Tips
- Give two different reasons, such as conserving species (biodiversity), reducing climate change by taking up carbon dioxide, reducing erosion, or tourism
- Two versions of the same reason only score once
Scientists investigated the survival time of patients with liver cancer who also had high blood pressure. The patients were in three groups.
- Group 1 had no treatment for high blood pressure.
- Group 2 were treated with drug J.
- Group 3 were treated with drug J and other drugs for high blood pressure.
The scientists used a statistical test to compare each group with liver cancer patients who had normal blood pressure.
Table 1
| Group | Mean survival time / months | P value compared with normal blood pressure |
|---|---|---|
| Normal blood pressure | 40.5 | – |
| 1 | 28.4 | 0.004 |
| 2 | 52.9 | 0.031 |
| 3 | 43.1 | 0.512 |
Using the information provided, what can you conclude about the effects of high blood pressure and the different drug treatments on the survival time of patients with liver cancer?
(5 marks)
Hint
Compare each mean with the normal blood pressure group. Which P values are below 0.05? What does comparing group 3 with group 2 suggest?
Mark Scheme
Max 5 marks
- Untreated high blood pressure (group 1) gives the lowest survival time, shorter than with normal blood pressure (1 mark)
- Drug J alone (group 2) gives the highest survival time (1 mark)
- Drug J with other drugs (group 3) gives a longer mean survival time than no treatment (group 1) (1 mark)
- The differences for groups 1 and 2 are significant (P < 0.05) (1 mark)
- The difference for group 3 is not significant (P > 0.05) (1 mark)
- Drug J alone is more effective than the combination, so the other drugs may reduce its effect (1 mark)
Also accepted / rejected
Also accepted
- “Not due to chance” for significant, and “due to chance” for not significant (points 4 and 5)
Not accepted
- “The results are significant” (points 4 and 5, as it’s the difference that is significant)
Tips
- Compare the means. Group 1 has the lowest survival time, group 2 the highest, and group 3 is longer than group 1
- Use the P values against 0.05. Groups 1 and 2 are significantly different from patients with normal blood pressure, but group 3 is not. Mention both groups 1 and 2
- A higher P value doesn’t mean more significant. Say the difference is significant, not “the results”
- Conclude that drug J alone works better than the combination, so the other drugs may reduce its effect
Short tandem repeats (STRs) are short base sequences, usually 2 to 7 base pairs long, that are repeated one after another. For example, the STR called TH01 is the sequence TCAT, repeated between 3 and 14 times. People differ in the number of repeats, so STRs are used in genetic fingerprinting.
DNA fragments containing STRs are separated by gel electrophoresis.
Explain why the fragments move towards the positive electrode, and why fragments with different numbers of repeats end up in different positions.
(2 marks)
Hint
Which part of a nucleotide carries a charge? How does the length of a fragment affect how easily it moves through the gel?
Mark Scheme
- DNA has a negative charge (from its phosphate groups), so it is attracted to the positive electrode (1 mark)
- Fragments with more repeats have a greater number of nucleotides (base pairs), so they are longer. Longer fragments move more slowly through the gel, so they don’t travel as far (1 mark)
Explanation (not marked): Each TCAT repeat adds 4 base pairs. A fragment with 10 repeats has 24 more base pairs than a fragment with 4 repeats, so it is longer and ends up nearer the wells.
Also accepted / rejected
Also accepted
- “Number of repeats” or “number of base pairs” (point 2)
- “Length” or “mass” (point 2)
Not accepted
- “Positive charge” (point 1)
Tips
- DNA has a negative charge from its phosphate groups. Don’t say positive, or mention R groups or amino acids
- Link the number of nucleotides to distance. Fragments with more repeats have more nucleotides and move more slowly, so fragments with fewer nucleotides travel further
- “Size” or “bigger” on its own isn’t enough. Say the number of nucleotides (or repeats), the length or the mass
Resting leg muscle contains about 6 × 10⁻³ mmol of ATP per gram. During a sprint, the muscle uses ATP at about 4.5 mmol per kg per second.
Calculate how long the ATP already in the muscle would last during a sprint, if no more ATP were made.
Give your answer to 2 significant figures.
Answer = ________ s
(1 mark)
Hint
The two values use different mass units. Convert one so that they match, then divide.
Mark Scheme
1.3 s (1 mark)
Working:
- Same units: 6 × 10⁻³ mmol g⁻¹ = 6 mmol kg⁻¹
- Time: 6 ÷ 4.5 = 1.3 s
Also accepted / rejected
Also accepted
- 1.33 s
Tips
- Use the same mass unit. 6 × 10⁻³ mmol g⁻¹ is 6 mmol kg⁻¹
- Then divide the amount of ATP by the rate it is used
During exercise, calcium ions in muscle cells increase the number of two types of transport protein in the cells’ membranes.
- GLUT4 transports glucose. There are more GLUT4 proteins in the cell-surface membrane.
- CD36 transports fatty acids. There are more CD36 proteins in the mitochondrial membranes.
Suggest and explain how having more GLUT4 and CD36 helps muscle cells during exercise.
(3 marks)
Hint
What does each protein let into where? What happens to glucose and fatty acids once they are inside, and what does the cell get from that?
Mark Scheme
Max 3 marks. An answer only about glucose, or only about fatty acids, scores max 2 marks.
GLUT4 (glucose)
- More glucose enters the muscle cells (1 mark)
- By facilitated diffusion (1 mark)
CD36 (fatty acids)
- More fatty acids enter the mitochondria, where they are used in the Krebs cycle (1 mark)
Why this helps
- Glucose and fatty acids are used in respiration, so more ATP is made for muscle contraction (1 mark)
Explanation (not marked): Exercising muscles use ATP much faster than resting muscles, so they need more glucose and fatty acids to respire.
Also accepted / rejected
Also accepted
- Active transport or co-transport (point 2)
- “The Krebs cycle makes ATP” (point 4)
Not accepted
- “Glucose enters the mitochondria” (point 1)
Tips
- Cover both proteins. Answers about only glucose or only fatty acids score 2 marks at most
- More glucose enters the muscle cells (not the mitochondria), by facilitated diffusion
- Fatty acids are used in the Krebs cycle. They aren’t turned into glucose first
- Say respiration makes more ATP. “Provides energy” isn’t enough
During a long cycle ride, the rider’s leg muscles respire faster, so the concentration of carbon dioxide in the blood rises. The heart rate increases.
Describe and explain how the increase in carbon dioxide causes the heart rate to increase.
(4 marks)
Hint
Which receptors detect carbon dioxide? Where do they send impulses, and which nerves carry impulses from there to the heart? Where in the heart do those nerves end?
Mark Scheme
- The increase in CO₂ (a fall in blood pH) is detected by chemoreceptors (1 mark)
- They send more impulses to the cardiac centre in the medulla (1 mark)
- More impulses go along sympathetic neurones, or fewer along parasympathetic (vagus) neurones (1 mark)
- To the SAN, which then sends out waves of electrical activity more often (1 mark)
Also accepted / rejected
Also accepted
- A fall in pH, or more H⁺, for more CO₂ (point 1)
- “Action potentials” for impulses (points 2 and 3)
Not accepted
- “Signals”, “messages” or “an impulse” for impulses (points 2 and 3)
Tips
- Chemoreceptors detect the increase in CO₂, which is a decrease in pH (not an increase)
- They send more impulses to the cardiac centre in the medulla. Write “impulses”, not “an impulse”, “signals” or “messages”
- More impulses go along sympathetic neurones (or fewer along the vagus nerve) to the SAN
- Don’t describe how the heartbeat is coordinated
Complete the passage by writing the correct biological term for each numbered gap.
Plants use the carbon dioxide they absorb to make (1) compounds, such as sugars, lipids and proteins. Some of the sugars are broken down in (2) to release energy, and the rest are used to build new cells. The biomass of a plant can be measured as the mass of (3) per unit area per year. To find the chemical energy stored in dry biomass, a sample can be burned using (4).
(2 marks)
Hint
Read each sentence carefully. Which process breaks sugars down to release energy? What is biomass often measured as? What method burns a sample to measure the energy in it?
Mark Scheme
4 correct = 2 marks; 2 or 3 correct = 1 mark
- Organic
- Respiration
- Carbon
- Calorimetry
Also accepted / rejected
Also accepted
- “Dry tissue” or “dry mass of tissue” (3)
- “A calorimeter” (4)
Not accepted
- “Colorimetry” (4)
- “Photosynthesis” (2)
Tips
- (1) organic, (2) respiration (not photosynthesis), (3) carbon, (4) calorimetry
- Calorimetry measures energy by burning a sample. Colorimetry measures colour, so don’t mix them up
A sheep eats grass. The net production of the sheep, N, can be worked out from:
- I, the chemical energy in the food it eats
- F, the chemical energy lost in its faeces and urine
- R, the energy lost in respiration.
Which equation gives N?
Tick (✓) one box.
Hint
Net production is what is left of the energy eaten. Which losses must be taken away?
Mark Scheme
C: N = I − (F + R) (1 mark)
Explanation (not marked): Both losses, in faeces and urine and in respiration, are subtracted from the energy in the food eaten.
Tips
- Net production of consumers is N = I − (F + R). Subtract both the losses in faeces and urine and the respiratory losses from the energy ingested
In one country, hens that are kept for laying eggs live either in free-range systems or in cages. Table 1 shows the number of egg-laying hens in the country in 2015 and 2020.
Table 1
| Year | Egg-laying hens / millions | Free-range / % | Caged / % |
|---|---|---|---|
| 2015 | 38.0 | 48 | 52 |
| 2020 | 40.0 | 56 | 44 |
In 2020, egg-laying hens made up 22% of all the poultry in the country (all the chickens, turkeys, ducks and geese).
Use Table 1 to calculate the percentage of all the poultry in 2020 that were free-range egg-laying hens.
Answer = ________ %
(1 mark)
Hint
Free-range hens are a percentage of the egg-laying hens, and the egg-laying hens are a percentage of all poultry. How do you combine two percentages?
Mark Scheme
12.3% (accept 12) (1 mark)
Working:
- 56% of 22% = 0.56 × 22 = 12.32%
Tips
- Free-range hens were 56% of the egg-laying hens, which were 22% of all poultry, so multiply 0.56 × 22 = 12.3%
- Round carefully if you round at all
In one country, hens that are kept for laying eggs live either in free-range systems or in cages. Table 1 shows the number of egg-laying hens in the country in 2015 and 2020.
Table 1
| Year | Egg-laying hens / millions | Free-range / % | Caged / % |
|---|---|---|---|
| 2015 | 38.0 | 48 | 52 |
| 2020 | 40.0 | 56 | 44 |
Use Table 1 to calculate the increase in the number of free-range egg-laying hens between 2015 and 2020.
Show your working.
Answer = ________
(2 marks)
Hint
Work out the number of free-range hens in each year, using that year’s total number of egg-laying hens. Then subtract.
Mark Scheme
4 160 000 (4.16 million) (2 marks)
Working:
- 2015: 48% of 38.0 million = 18.24 million
- 2020: 56% of 40.0 million = 22.4 million
- Increase: 22.4 − 18.24 = 4.16 million
If the answer is wrong, 1 mark for any of:
- 18.24 million or 22.4 million in the working
- the digits 416 with the wrong power of ten
Also accepted / rejected
Also accepted
- 4.2 million
Tips
- Work out each year using its own total number of egg-laying hens, not the same total for both years
- Then subtract to give the increase in number. Don’t give it as a percentage increase
Some soil bacteria release an enzyme called phosphatase. Phosphatase hydrolyses organic compounds in dead material, releasing phosphate ions that the bacteria absorb. When phosphate ions are already available in their surroundings, the bacteria can absorb these instead.
A scientist investigated the effect of the concentration of potassium phosphate on phosphatase activity in one species of soil bacterium. She set up several flasks, each containing the same volume of liquid growth medium with a different concentration of potassium phosphate, and added the bacteria to each flask.
After a set time, she:
- measured the phosphatase activity, in arbitrary units
- removed the bacteria and measured the concentration of potassium phosphate left in the medium.
Apart from temperature and pH, give two variables the scientist should have controlled when setting up the flasks.
(2 marks)
Hint
What else could affect how much phosphatase activity there is? Think about the bacteria added, what they need to respire and grow, and how long they are left.
Mark Scheme
Max 2 marks
- The volume of bacterial culture added (1 mark)
- The concentration (number) of bacteria added (1 mark)
- The concentration of glucose (respiratory substrate) in the medium (1 mark)
- The volume of potassium phosphate solution added (1 mark)
- The time the flasks are left (1 mark)
- The concentration of oxygen (1 mark)
Also accepted / rejected
Also accepted
- The number or mass of bacteria (points 1 and 2)
- Another named respiratory substrate or nutrient (point 3)
Tips
- Don’t give temperature or pH (they’re excluded), the volume of growth medium (already the same) or the potassium phosphate concentration (the independent variable)
- Think about what the bacteria need to respire and grow, such as glucose and oxygen
- Say “concentration” or “volume”, not “amount”
Some soil bacteria release an enzyme called phosphatase. Phosphatase hydrolyses organic compounds in dead material, releasing phosphate ions that the bacteria absorb. When phosphate ions are already available in their surroundings, the bacteria can absorb these instead.
A scientist investigated the effect of the concentration of potassium phosphate on phosphatase activity in one species of soil bacterium. She set up several flasks, each containing the same volume of liquid growth medium with a different concentration of potassium phosphate, and added the bacteria to each flask.
After a set time, she:
- measured the phosphatase activity, in arbitrary units
- removed the bacteria and measured the concentration of potassium phosphate left in the medium.
Table 1
| Potassium phosphate added / µg cm⁻³ | Phosphatase activity / arbitrary units | Potassium phosphate left / µg cm⁻³ |
|---|---|---|
| 0 | 60 | 0 |
| 10 | 41 | 0 |
| 20 | 22 | 0 |
| 30 | 8 | 0 |
| 40 | 0 | 5 |
| 50 | 0 | 13 |
A student concluded that phosphate ions reduce phosphatase activity in soil bacteria.
Use all the information to evaluate the student’s conclusion.
(3 marks)
Hint
What happens to phosphatase activity as more potassium phosphate is added? Is anything left over when the activity stops? What else was added with the phosphate, and how many species were tested?
Mark Scheme
Max 3 marks
Supports
- Phosphatase activity decreases as the potassium phosphate concentration increases (1 mark)
- Activity is zero at 40 µg cm⁻³ and above, or potassium phosphate is left over when activity is zero (1 mark)
Doesn’t support
- Only one species of bacterium was used (1 mark)
- The effect could be caused by the potassium ions, because potassium phosphate was used, not phosphate ions alone (1 mark)
Explanation (not marked): Potassium phosphate being left over when phosphatase activity is zero suggests the bacteria had more phosphate than they could use, so they stopped making phosphatase.
Also accepted / rejected
Also accepted
- A negative correlation (point 1)
Not accepted
- “Potassium” without saying ions, or “phosphorus” for phosphate (point 4)
Tips
- Supports. Phosphatase activity falls as potassium phosphate increases, and it reaches zero at high concentrations
- Doesn’t support. Only one species was used, and the effect could be due to the potassium ions, because potassium phosphate was used, not phosphate ions alone
- The differences are very large, so “no statistical test” isn’t credited, and neither is “correlation doesn’t mean causation”
Some soil bacteria release the enzyme phosphatase, which releases phosphate ions from organic compounds in dead material. When phosphate ions are already available, the bacteria make much less phosphatase.
Phosphatase is a protein, so amino acids and ATP are needed to make it.
Suggest how the bacteria benefit from making less phosphatase when phosphate ions are available.
(2 marks)
Hint
What does making a protein use up? If the bacteria don’t need to make phosphatase, what else could they use those resources for?
Mark Scheme
- Fewer amino acids and less ATP are used making phosphatase (1 mark)
- So these can be used for growth, such as making other proteins, or for active transport (1 mark)
Explanation (not marked): Making a protein uses amino acids and ATP. If the bacteria don’t need phosphatase, they can use these resources to grow and divide faster instead.
Also accepted / rejected
Also accepted
- Another named process that uses ATP, e.g. DNA replication (point 2)
Not accepted
- ATP “used in respiration” (point 2)
Tips
- Say what is saved. Fewer amino acids and less ATP are used making the enzyme
- Then say what they can be used for instead, such as growth, making other proteins or active transport
- Don’t say the ATP is “used in respiration”
Which process happens in aerobic respiration but not in anaerobic respiration?
Tick (✓) one box.
Hint
Which stages of respiration need oxygen? Which stages happen in both types?
Mark Scheme
C: Oxidative phosphorylation (1 mark)
Explanation (not marked): Oxidative phosphorylation needs oxygen as the final electron acceptor. Glycolysis, including the oxidation of triose phosphate and substrate-level phosphorylation, happens in both aerobic and anaerobic respiration.
Tips
- Glycolysis happens in both aerobic and anaerobic respiration, so anything in glycolysis isn’t the answer
- Oxidative phosphorylation needs oxygen, so it only happens in aerobic respiration
Figure 1 shows a respirometer used to measure the rate of aerobic respiration of germinating peas.
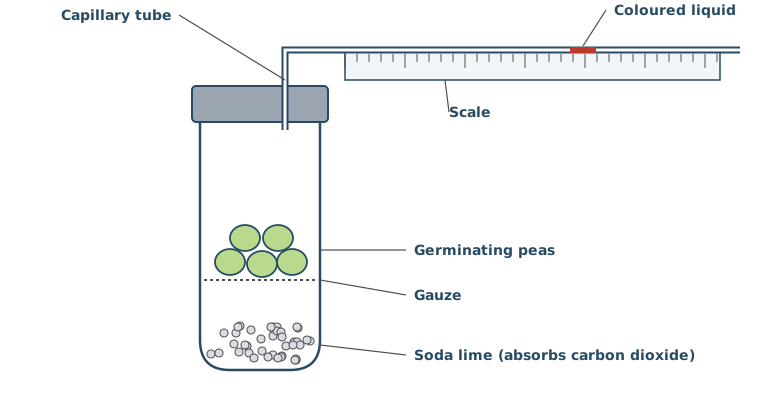
Over 4 hours, the drop of coloured liquid moved towards the tube of peas.
Explain why.
(3 marks)
Hint
What gas do the peas take up, and what gas do they give out? What happens to the gas they give out? So what happens to the volume of gas in the tube?
Mark Scheme
- The peas take up oxygen (1 mark)
- The carbon dioxide they release is absorbed by the soda lime (1 mark)
- So the volume and pressure of gas in the tube decrease, and the liquid moves towards the peas (1 mark)
Also accepted / rejected
Not accepted
- “A vacuum forms” (point 3)
Tips
- The peas take up oxygen, and the carbon dioxide they release is absorbed by the soda lime
- So the volume and pressure of gas in the tube decrease, and the liquid moves towards the peas
- Say the pressure decreases. It doesn’t increase, and it isn’t a vacuum
Figure 1 shows a respirometer used to measure the rate of aerobic respiration of germinating peas.
Apart from time, give two measurements the student must make to find the rate of oxygen uptake in cm³ h⁻¹.
(2 marks)
Hint
The answer needs a volume. How could you work out the volume of gas from the movement of the liquid in the capillary tube?
Mark Scheme
- The distance the coloured liquid moves (1 mark)
- The diameter (or radius) of the capillary tube (1 mark)
Explanation (not marked): The volume of oxygen taken up is the volume of the cylinder of tube the liquid moved along, so volume = πr² × distance. Dividing by the time gives cm³ h⁻¹.
Also accepted / rejected
Also accepted
- The start and end positions of the liquid (point 1)
- The cross-sectional area of the tube (point 2)
Tips
- Measure how far the liquid moves and the diameter (or radius) of the tube, so you can calculate the volume
- Time is already excluded, and the mass of peas isn’t needed for a rate in cm³ h⁻¹
Figure 1 shows a respirometer used to measure the rate of aerobic respiration of germinating peas.
The student used the respirometer in Figure 1 to measure the volume of oxygen taken up by the peas.
The student then wanted to find the volume of carbon dioxide released by the same peas, using the same respirometer.
Describe the change the student should make to the contents of the respirometer, and explain how the student could then work out the volume of carbon dioxide released.
(3 marks)
Hint
What would happen to the carbon dioxide if the soda lime weren’t there? How could you compare the two sets of readings?
Mark Scheme
- Remove the soda lime (or replace it with water) (1 mark)
- Measure the distance the liquid moves without soda lime (1 mark)
- Use the difference between the distances (or volumes) with and without soda lime (1 mark)
Explanation (not marked): With soda lime, the movement shows the oxygen taken up. Without it, the carbon dioxide released makes up for some or all of the oxygen taken up, so the liquid moves less, or not at all. The difference between the two volumes is the volume of carbon dioxide released.
Also accepted / rejected
Also accepted
- “The liquid doesn’t move, so the volume of carbon dioxide released equals the volume of oxygen taken up” (points 2 and 3)
Not accepted
- Removing the peas or using a different organism (point 1)
- Adding a syringe, as it’s the same respirometer (points 2 and 3)
Tips
- It’s the same respirometer, so don’t add a syringe. Change the contents by removing the soda lime
- Record how far the liquid moves without soda lime, then use the difference from the run with soda lime
- In aerobic respiration the liquid won’t move away from the peas, so don’t describe it moving the other way
Using a respirometer, a student found that 15 g of germinating peas took up 0.36 cm³ of oxygen in 4 hours.
Calculate the rate of oxygen uptake in cm³ g⁻¹ h⁻¹.
Give your answer in standard form.
Answer = ________ cm³ g⁻¹ h⁻¹
(1 mark)
Hint
Divide by both the mass and the time.
Mark Scheme
6.0 × 10⁻³ cm³ g⁻¹ h⁻¹ (1 mark)
Working:
- Per gram: 0.36 ÷ 15 = 0.024 cm³ g⁻¹
- Per hour: 0.024 ÷ 4 = 0.006 = 6.0 × 10⁻³ cm³ g⁻¹ h⁻¹
Also accepted / rejected
Also accepted
- 6 × 10⁻³
Tips
- Divide by both the mass and the time
- Include the power of ten, and check it’s the right one
Chimpanzees and bonobos are closely related species of ape that live in the forests of central Africa. Scientists used a computer model to predict where each species could live, based on its environmental needs. They then recorded where each species was actually found.
Figure 1 is a simplified map of the results.
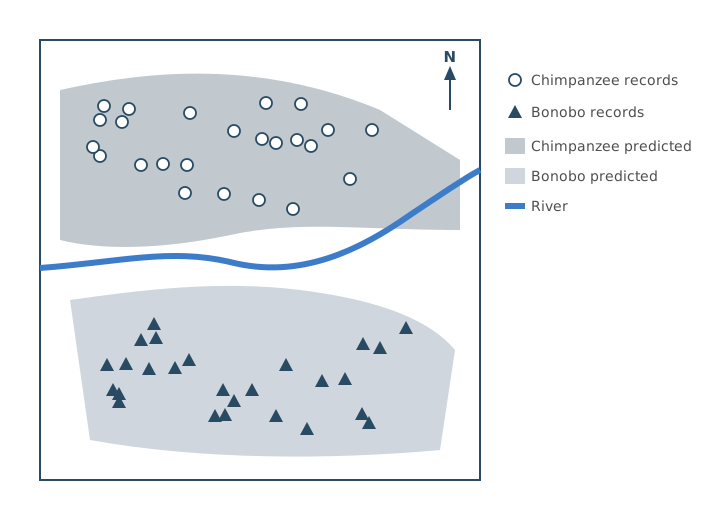
Using Figure 1, give three conclusions about the distribution of these two species.
(3 marks)
Hint
Where is each species found, compared with the river? How do the records compare with the predicted ranges?
Mark Scheme
- Chimpanzees are only found north of the river (1 mark)
- Bonobos are only found south of the river (1 mark)
- The actual distribution is similar to (or a little smaller than) the predicted distribution (1 mark)
Also accepted / rejected
Also accepted
- If neither point 1 nor point 2 is given, “the river separates them” or “their ranges don’t overlap” (1 mark)
Tips
- Name each species with a direction. Chimpanzees are north of the river and bonobos are south of it
- Compare the records with the predictions. The actual distribution is similar to, or a little smaller than, the predicted one
- Read the key carefully, and don’t guess at the conditions each species prefers
Chimpanzees and bonobos evolved from a common ancestor. Today, chimpanzees live only north of a large river in central Africa, and bonobos live only south of it. Neither species can swim.
Suggest how the river could have led to the formation of these two species.
(5 marks)
Hint
What did the river do to the ancestral population? What happens to the alleles in two populations that can’t meet? When are they counted as separate species?
Mark Scheme
Max 5 marks
- The river caused geographical isolation (allopatric speciation) (1 mark)
- So there was no gene flow between the two populations (separate gene pools) (1 mark)
- Mutations produced new variation in each population (1 mark)
- There were different selection pressures on each side of the river (1 mark)
- Different alleles were selected, so the allele frequencies changed (1 mark)
- Eventually they could no longer interbreed to produce fertile offspring (1 mark)
Also accepted / rejected
Also accepted
- “Reproductive isolation” for no gene flow (point 2)
- Different environmental conditions for different selection pressures (point 4)
Not accepted
- “Sympatric speciation” (point 1)
- Mutations caused by the environment, or “mutating to adapt” (point 3)
Tips
- The river caused geographical isolation (allopatric, not sympatric), so there was no gene flow between the two populations from the start
- Mutations arise randomly in each population. The apes don’t mutate to adapt, and conditions don’t cause mutations
- Different selection pressures mean different alleles are passed on, changing the allele frequencies
- Finish with both parts. They can no longer interbreed to produce fertile offspring
Scientists used the mark-release-recapture method to estimate the number of red squirrels in a forest. They marked each squirrel they caught with a small coloured tag on its ear.
Suggest one precaution needed when marking the squirrels, so that the estimate is valid.
(1 mark)
Hint
What could the mark do to a squirrel’s chances of surviving, or of being caught again? What if the mark were lost?
Mark Scheme
The tag must not affect the squirrels’ survival (e.g. not make them easier for predators to see) or their chance of being recaptured, or it must not fall off (1 mark)
Also accepted / rejected
Also accepted
- The mark must not be toxic (1 mark)
Tips
- The mark mustn’t affect survival, predation or the chance of recapture, and mustn’t fall off
- “Doesn’t harm them” on its own is too vague. Answer about the mark, not the sample size
Scientists estimated the number of red squirrels in a forest by mark-release-recapture.
- In the first sample, they caught, marked and released 40 squirrels.
- A week later, they caught 36 squirrels in the second sample.
- They estimated that there were 240 squirrels in the forest.
Calculate how many squirrels in the second sample were marked.
Answer = ________
(1 mark)
Hint
Write down the formula for the population estimate. Which value are you missing? Rearrange to find it.
Mark Scheme
6 (1 mark)
Working:
- Population = number in first sample × number in second samplenumber marked in second sample
- Number marked in second sample = 40 × 36 ÷ 240 = 6
Tips
- Rearrange the formula. Number marked in the second sample = first sample × second sample ÷ population
In humans, the ABO blood group is controlled by one gene with three alleles, IA, IB and IO. IA and IB are codominant, and IO is recessive to both.
Albinism is controlled by a different gene. The allele for albinism, n, is recessive to the allele for normal pigmentation, N. Neither gene is sex-linked, and they are on different chromosomes.
Figure 1 shows a family tree, with each person’s ABO blood group. Shaded symbols show people with albinism.
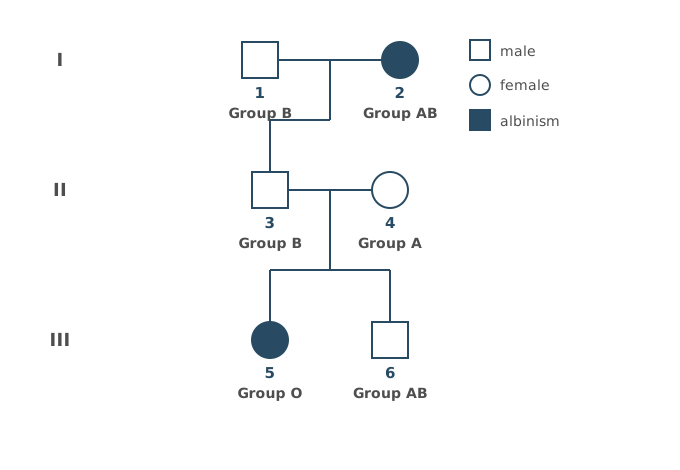
Give the ABO genotypes of individuals 1 and 2.
(1 mark)
Hint
Start with individual 2. Then look at individual 5. Where could each of 5’s alleles have come from?
Mark Scheme
(1) IBIO and (2) IAIB (1 mark, both needed)
Explanation (not marked): Individual 2 has group AB, so must be IAIB. Individual 5 has group O (IOIO), so her father, 3, must carry IO. 3 couldn’t get IO from 2, so it came from 1. 1 has group B, so 1 is IBIO.
Also accepted / rejected
Also accepted
- The alleles in either order, or written as BO and AB
Tips
- Individual 1 has group B, but must be IBIO, not IBIB. Trace the IO allele back from individual 5
- Give one genotype for each person, and don’t put the alleles on sex chromosomes
In humans, the ABO blood group is controlled by one gene with three alleles, IA, IB and IO. IA and IB are codominant, and IO is recessive to both.
Albinism is controlled by a different gene. The allele for albinism, n, is recessive to the allele for normal pigmentation, N. Neither gene is sex-linked, and they are on different chromosomes.
Figure 1 shows a family tree, with each person’s ABO blood group. Shaded symbols show people with albinism.
You can assume that individual 1 is heterozygous for the albinism gene.
Calculate the probability that the next child of individuals 1 and 2 will be a daughter with blood group AB and albinism.
Show your working.
Answer = ________
(2 marks)
Hint
What gametes can individuals 1 and 2 each make? Draw a Punnett square. How many boxes are group AB with albinism, and what is the chance the child is a girl?
Mark Scheme
1/16 (0.0625 or 6.25%) (2 marks)
Working:
- Individual 1 is IBIONn, so makes four types of gamete: IB N, IB n, IO N and IO n
- Individual 2 is IAIBnn, so makes two types: IA n and IB n
Gametes from 2
Gametes from 1
| IA n | IB n | |
|---|---|---|
| IB N | IAIBNnAB | IBIBNnB |
| IB n | IAIBnnAB, albinism | IBIBnnB, albinism |
| IO N | IAIONnA | IBIONnB |
| IO n | IAIOnnA, albinism | IBIOnnB, albinism |
- 1 of the 8 boxes is group AB with albinism (IAIBnn), so 1/8
- The chance of a daughter is ½, so 1/8 × ½ = 1/16
Explanation (not marked): A quicker way is to multiply the separate chances. Group AB (¼) × albinism (½) × a daughter (½) = 1/16.
If the answer is wrong, 1 mark for:
- 1/8 (0.125), which leaves out the chance of a daughter
Also accepted / rejected
Also accepted
- 1 in 16, or an equivalent fraction such as 2/32
Tips
- Multiply the separate probabilities. Blood group AB (¼) × albinism (½) × a daughter (½) = 1/16
- Don’t forget the chance of being a girl. Leaving it out gives 1/8
The ABO blood group gene has three alleles, IA, IB and IO.
In a large population, the frequency of the IA allele is 0.26 and the frequency of the IO allele is 0.63.
What is the frequency of the IB allele?
Answer = ________
(1 mark)
Hint
What do the frequencies of all the alleles of one gene add up to?
Mark Scheme
0.11 (1 mark)
Working:
- 1 − 0.26 − 0.63 = 0.11
Tips
- The frequencies of all the alleles of a gene add up to 1, so 1 − 0.26 − 0.63 = 0.11
Scientists recorded the ABO blood group of each person in a large population, and whether or not they had albinism. This gave eight phenotypes (group A, group B, group AB and group O, each with or without albinism).
They used a statistical test to find out whether the observed numbers of each phenotype were significantly different from the numbers expected.
Name the statistical test they should use, and give the number of degrees of freedom.
(2 marks)
Hint
Which test compares observed and expected numbers in categories? How do you find the degrees of freedom from the number of categories?
Mark Scheme
- Chi-squared (χ²) test (1 mark)
- 7 degrees of freedom (1 mark)
Explanation (not marked): Degrees of freedom = number of categories − 1. There are eight phenotypes, so 8 − 1 = 7.
Tips
- Comparing observed and expected numbers in categories uses the chi-squared test
- Degrees of freedom = number of categories − 1, so eight phenotypes gives 7
Lambert–Eaton syndrome is an autoimmune disease. Antibodies bind to the calcium ion channels in the presynaptic membrane at neuromuscular junctions, so fewer of the channels open. This weakens muscle contraction.
Suggest and explain how Lambert–Eaton syndrome weakens muscle contraction.
You do not need to describe what happens inside the muscle fibre.
(2 marks)
Hint
What do calcium ions normally trigger at the presynaptic membrane? What happens at the sarcolemma if less neurotransmitter arrives?
Mark Scheme
- Less acetylcholine is released, so less acetylcholine binds to receptors on the sarcolemma (1 mark)
- So there is less depolarisation, or fewer action potentials in the muscle fibre (1 mark)
Explanation (not marked): Fewer calcium ions enter the synaptic knob, so fewer vesicles fuse with the presynaptic membrane and less acetylcholine is released into the cleft.
Also accepted / rejected
Also accepted
- Fewer sodium ions enter, so threshold isn’t reached (point 2)
Not accepted
- “Active site” for receptor (point 1)
Tips
- Less acetylcholine binds to its receptors. Say “receptors”, not just “the membrane”, and not “active site”
- So there is less depolarisation and fewer action potentials. Action potentials aren’t “weaker”
Lambert–Eaton syndrome is an autoimmune disease in which less acetylcholine is released at neuromuscular junctions, which weakens muscle contraction.
Pyridostigmine is a drug that inhibits the enzyme acetylcholinesterase.
Explain how pyridostigmine can help people with Lambert–Eaton syndrome.
(3 marks)
Hint
What does acetylcholinesterase normally do? If it is inhibited, what happens to the acetylcholine in the cleft?
Mark Scheme
- Less acetylcholine is broken down (1 mark)
- So more acetylcholine binds to receptors on the sarcolemma (1 mark)
- So depolarisation happens, and action potentials are produced in the muscle fibre (1 mark)
Also accepted / rejected
Also accepted
- “Acetylcholine stays bound to the receptors for longer” (points 1 and 2)
- “Enough sodium ions enter to reach threshold” (point 3)
Tips
- Less acetylcholine is broken down, so more binds to receptors. Include “receptors”
- So depolarisation happens and action potentials are produced
Scientists wanted to produce mice with the features of type II diabetes, to use in research. They:
- split the mice into two groups, C and H
- fed group C a normal diet (10% fat) and group H a high-fat diet (60% fat) for 4 weeks
- then injected every mouse with the drug streptozotocin (STZ), at 40 mg per kg of body mass
- measured the mean body mass and mean blood glucose concentration of each group 1 week later.
Calculate the mass of STZ, in grams, that should be injected into a mouse with a body mass of 28.6 g.
Give your answer in standard form.
Show your working.
Answer = ________ g
(2 marks)
Hint
The dose is per kg, so convert the mouse’s mass to kg first. Then convert the answer from mg to g.
Mark Scheme
1.14 × 10⁻³ g (2 marks)
Working:
- Mass in kg: 28.6 ÷ 1000 = 0.0286 kg
- Dose: 0.0286 × 40 = 1.144 mg
- In g: 1.144 ÷ 1000 = 1.14 × 10⁻³ g
If the answer is wrong, 1 mark for any of:
- the right answer not in standard form (0.00114 g)
- the digits 114 with the wrong power of ten
Also accepted / rejected
Also accepted
- 1.1 × 10⁻³ or 1.144 × 10⁻³ g
Tips
- Convert the mass to kg (0.0286 kg), multiply by 40 mg kg⁻¹ to get 1.144 mg, then convert mg to g
- Include × 10⁻³, and round correctly
Scientists wanted to produce mice with the features of type II diabetes, to use in research. They:
- split the mice into two groups, C and H
- fed group C a normal diet (10% fat) and group H a high-fat diet (60% fat) for 4 weeks
- then injected every mouse with the drug streptozotocin (STZ), at 40 mg per kg of body mass
- measured the mean body mass and mean blood glucose concentration of each group 1 week later.
Suggest why STZ was given per kg of body mass.
(1 mark)
Hint
Do all the mice have the same mass? What would happen to the comparison if every mouse got the same dose?
Mark Scheme
Mice vary in mass, so each mouse gets a dose relative to its mass, which allows a valid comparison (1 mark)
Also accepted / rejected
Also accepted
- “So the concentration in the body is the same in every mouse”
- “Weight” for mass
Tips
- Mice vary in mass, so a dose per kg gives each mouse a quantity relative to its mass, for a valid comparison
- Say “mass”, not “size”
Scientists wanted to produce mice with the features of type II diabetes, to use in research. They:
- split the mice into two groups, C and H
- fed group C a normal diet (10% fat) and group H a high-fat diet (60% fat) for 4 weeks
- then injected every mouse with the drug streptozotocin (STZ), at 40 mg per kg of body mass
- measured the mean body mass and mean blood glucose concentration of each group 1 week later.
Table 1 shows the results. The values after ± are 2 standard deviations, so the mean ± 2 SD includes over 95% of the data.
Table 1
| Group | Mean body mass / g | Mean blood glucose / mmol dm⁻³ |
|---|---|---|
| C (normal diet) | 26.4 ± 1.2 | 7.2 ± 0.9 |
| H (high-fat diet) | 31.8 ± 1.6 | 16.5 ± 1.4 |
The scientists concluded that group H mice could be used to study type II diabetes in humans.
Use all the information and your knowledge of type II diabetes to evaluate this conclusion.
(5 marks)
Hint
Work out the ranges (mean ± 2 SD). Do they overlap? How do the results match what you know about type II diabetes? What are the limits of the study?
Mark Scheme
Max 5 marks
Supports
- The ± 2 SD ranges don’t overlap, for blood glucose or for body mass (1 mark)
- So there is a significant increase in blood glucose (or body mass) in group H (1 mark)
- Type II diabetes causes high blood glucose (1 mark)
- Obesity (high body mass) or a high-fat diet is a risk factor for type II diabetes (1 mark)
Limitations
- It was done on mice, not humans (1 mark)
- Results were only measured 1 week after the injection, so long-term effects aren’t known (1 mark)
Explanation (not marked): Blood glucose ranges are 6.3 to 8.1 mmol dm⁻³ (C) and 15.1 to 17.9 mmol dm⁻³ (H). Body mass ranges are 25.2 to 27.6 g (C) and 30.2 to 33.4 g (H). Neither pair overlaps.
Also accepted / rejected
Also accepted
- “The difference is not due to chance” for significant (point 2)
Not accepted
- “Sugar” for glucose (point 3)
Tips
- Work out the ± 2 SD ranges. They don’t overlap for glucose or mass, so the differences are significant
- Link to type II diabetes. It causes high blood glucose, and obesity and a high-fat diet are risk factors
- Limitations include using mice rather than humans, over a short time, so long-term effects aren’t known
Scientists gave mice a much higher dose of the drug streptozotocin (STZ). This destroyed the β cells in the pancreas. The scientists concluded that these mice would not be suitable for studying type II diabetes.
Give two reasons for this conclusion.
(2 marks)
Hint
What happens to insulin production in type II diabetes? What is the main problem in type II, and is that the same as having no β cells?
Mark Scheme
Max 2 marks
- In type II diabetes, insulin is still produced (1 mark)
- In type II diabetes, the receptors are less responsive to insulin (1 mark)
- The β cells aren’t destroyed in type II diabetes, so these mice are more like type I (1 mark)
- Damage to the pancreas could affect other processes, such as glucagon or digestive enzyme release (1 mark)
Also accepted / rejected
Also accepted
- “Faulty” or “fewer” insulin receptors (point 2)
Tips
- In type II diabetes insulin is still produced, but the receptors are less responsive to it. Mention receptors
- β cells aren’t destroyed in type II, and destroying them could affect other processes, such as glucagon release
- Ethics, or “the dose would kill the mice”, don’t answer the question
In one type of diabetes insipidus, the posterior pituitary releases very little ADH.
Suggest two symptoms that a person with this condition may have.
(2 marks)
Hint
Without ADH, how much water is reabsorbed from the collecting ducts? What does that do to the urine and to the body’s water?
Mark Scheme
Max 2 marks
- Thirst or dehydration (1 mark)
- A large volume of urine, or frequent urination (1 mark)
- Dilute (pale) urine (1 mark)
Explanation (not marked): With little ADH, the collecting ducts are less permeable to water, so less water is reabsorbed into the blood. More water leaves in the urine.
Also accepted / rejected
Also accepted
- “Increased urination” (point 2)
Tips
- Less ADH means less water is reabsorbed, so there is a large volume of dilute urine, thirst and dehydration
- Don’t give the effects of more ADH, such as concentrated urine
A blood test for the protein CA-125 is sometimes used to help diagnose ovarian cancer. Women with ovarian cancer often have a high concentration of CA-125 in their blood. Other conditions, such as endometriosis (a non-cancerous condition of the lining of the uterus), can also raise the concentration of CA-125.
Explain why a high CA-125 result is not enough on its own to diagnose ovarian cancer.
(2 marks)
Hint
Is a high CA-125 concentration only ever caused by cancer? What else could cause it?
Mark Scheme
- A high CA-125 concentration is not always caused by cancer, so it could be a false positive (1 mark)
- It could be caused by endometriosis (another condition) (1 mark)
Tips
- A high CA-125 concentration isn’t always cancer. It could be caused by another condition, such as endometriosis (from the information given)
- Say “high CA-125”, and name the other condition
Drug T is being developed to treat infections caused by the bacterium Staphylococcus aureus. Drug T blocks the channel in ATP synthase that hydrogen ions (protons) pass through.
Explain how drug T could kill these bacteria.
(3 marks)
Hint
What normally passes through ATP synthase, and what does that movement provide? What would the bacterium then be short of, and what does a cell need it for?
Mark Scheme
- Fewer hydrogen ions (protons) move through ATP synthase (1 mark)
- So there is less energy to make ATP from ADP and phosphate (1 mark)
- So there is less ATP for energy-requiring processes, such as active transport, protein synthesis or DNA replication (needed for binary fission), and the cell dies (1 mark)
Explanation (not marked): Bacteria have no mitochondria. Their electron transfer chain is in the cell-surface membrane, and hydrogen ions normally move back through ATP synthase down their concentration gradient (chemiosmosis), which provides the energy to make ATP.
Also accepted / rejected
Also accepted
- “Less chemiosmosis” (point 1)
- “Less oxidative phosphorylation” (point 2)
- Any other named process that uses ATP (point 3)
Not accepted
- Hydrogen ions moving through ATP synthase in mitochondria (point 1)
- Energy being “produced” (points 2 and 3)
- “Less ATP for respiration” (point 3)
Tips
- Start where the drug acts. Hydrogen ions can no longer move through ATP synthase
- Bacteria don’t have mitochondria, so don’t describe hydrogen ions moving in a mitochondrion
- Say there is less energy to make ATP. Energy is never “produced”
- Name a process that needs ATP, such as active transport or protein synthesis. “Less energy for respiration” doesn’t answer it
Table 1 shows four statements and four parts of a nephron.
Put a tick (✓) in each box where the statement is true for that part of the nephron.
Table 1
| Statement | Glomerulus | Proximal convoluted tubule | Loop of Henle | Collecting duct |
|---|---|---|---|---|
| Small molecules are filtered out of the blood | ||||
| Glucose is reabsorbed by co-transport | ||||
| Water leaves the filtrate by osmosis | ||||
| Its permeability to water is controlled by ADH |
(2 marks)
Hint
Where does ultrafiltration happen? Where is the glucose reabsorbed? In which parts can water leave the filtrate, and which part does ADH act on?
Mark Scheme
All four rows correct = 2 marks; 2 or 3 rows correct = 1 mark
| Statement | Glomerulus | Proximal convoluted tubule | Loop of Henle | Collecting duct |
|---|---|---|---|---|
| Small molecules are filtered out of the blood | ✓ | |||
| Glucose is reabsorbed by co-transport | ✓ | |||
| Water leaves the filtrate by osmosis | ✓ | ✓ | ✓ | |
| Its permeability to water is controlled by ADH | ✓ |
Explanation (not marked): Water leaves the filtrate in the proximal convoluted tubule, the descending limb of the loop of Henle and the collecting duct, so that row needs three ticks. ADH acts on the collecting duct (and the distal convoluted tubule, which isn’t in the table).
Tips
- Some rows need more than one tick, so don’t assume there is one tick per row
- Water leaves the filtrate in the proximal convoluted tubule, the loop of Henle and the collecting duct, not only where ADH acts
In a healthy person, glucose is found in the filtrate in the Bowman’s capsule, but plasma proteins are not.
Explain why plasma proteins are not found in the filtrate.
(2 marks)
Hint
Compare the size of a glucose molecule with a protein. Which layer between the blood and the filtrate acts as the filter?
Mark Scheme
- Plasma proteins are too large (1 mark)
- To pass through the basement membrane (1 mark)
Explanation (not marked): Glucose is small enough to pass through the basement membrane, so it’s filtered out of the blood, but the large proteins stay in the blood.
Also accepted / rejected
Not accepted
- “Membrane”, “capillary wall” or “glomerulus” without naming the basement membrane (point 2)
Tips
- Name the filter. Plasma proteins are too large to pass through the basement membrane. “The membrane” or “the glomerulus” isn’t specific enough
- There are proteins in blood plasma, so don’t say they have all been digested into amino acids
Protein is not normally found in urine. Protein in the urine can be a sign of kidney damage.
Scientists investigated the effect of a high-salt diet on the kidneys of young mice. They fed:
- 15 young mice a high-salt diet
- 15 young mice a normal-salt diet.
After 8 weeks, both groups were fed the same diet. At 1 year old, the scientists measured the concentration of protein in each mouse’s urine.
Mice fed the high-salt diet had a higher concentration of protein in their urine. The scientists carried out a statistical test and found P < 0.05.
A newspaper headline said, “Salty snacks in childhood could damage children’s kidneys for life”.
Use all of the information provided to evaluate this headline.
(5 marks)
Hint
What does P < 0.05 tell you? How similar are mice to humans? What does the headline claim that the study didn’t test? Think about the species, the time, the diet and the size of the study.
Mark Scheme
Max 5 marks. Max 4 marks from the Doesn’t support points.
Supports
- P < 0.05, so there is less than a 5% probability that the difference in protein is due to chance (1 mark)
- Mice and humans are both mammals, so their kidneys are likely to be similar (1 mark)
Doesn’t support
- It was only done on mice, not children (1 mark)
- Protein was only measured at 1 year old, so we don’t know if the damage lasts for life (1 mark)
- A small sample (15 in each group), so the results may not be representative (1 mark)
- Only two salt diets were compared, or the amount of salt isn’t given (it may be more than in salty snacks) (1 mark)
- Only protein in the urine was measured, so we don’t know about other kidney damage (1 mark)
Explanation (not marked): Protein in the urine suggests the basement membrane in the glomerulus has been damaged, because plasma proteins are normally too large to be filtered.
Also accepted / rejected
Also accepted
- “More than a 95% probability that the difference is not due to chance” (point 1)
Not accepted
- “The results are significant” without saying what P < 0.05 means (point 1)
Tips
- Explain what P < 0.05 means. There is less than a 5% probability that the difference is due to chance. “The results are significant” on its own isn’t enough
- If you mention sample size, say why it matters. A small sample may not be representative
- Use the information given. Protein was only measured at 1 year old, so “for life” wasn’t tested, and a high-salt diet isn’t the same as salty snacks
- Avoid points the information already rules out, such as “there was no comparison group”
Ecologists used the mark-release-recapture method to estimate the size of a population of seven-spot ladybirds, Coccinella septempunctata, in a meadow.
Table 1 shows the life cycle of the seven-spot ladybird.
Table 1
| Months | What the ladybirds are doing |
|---|---|
| October to March | Adults hibernate in leaf litter and are not active |
| April | Adults become active and mate |
| May to June | Females lay eggs, and the larvae feed and grow |
| July to mid-August | Larvae become pupae, and new adults emerge |
| Mid-August to September | Adults are active and feed on aphids |
Two other ladybirds with red wing cases and black spots live in the same meadow, the eleven-spot ladybird and some forms of the harlequin ladybird. All three species are a similar size, 4 to 8 mm long.
The ecologists caught and marked the first sample in the first week of September. They identified the species of each ladybird before marking it.
Use the information provided to suggest:
- two reasons why the first sample was caught in the first week of September
- one reason why each ladybird was identified before it was marked.
(3 marks)
Hint
Look at Table 1. What has already happened by September, and what happens in October? Why might the ecologists catch the wrong ladybird?
Mark Scheme
Max 3 marks. Max 2 marks from points 1 to 5, and max 1 mark from points 6 and 7.
Reasons for the first week of September
- All the new adults have emerged (none are still pupae) (1 mark)
- No new adults are being added, so the population size won’t change between the samples (1 mark)
- There is time to recapture them before they hibernate in October (1 mark)
- It doesn’t disturb mating or egg laying (1 mark)
- The adults are active, so the marked ladybirds can mix randomly with the rest of the population (1 mark)
Reason for identifying each ladybird
- The other ladybirds look similar (red with black spots, and a similar size) (1 mark)
- Only the seven-spot ladybird population is being estimated (1 mark)
Tips
- Give two different reasons for the timing. For example, all the new adults have emerged, and there’s time to recapture them before they hibernate in October
- Don’t give two versions of the same point, and “they are adults” on its own isn’t enough
- They’re identified first because the other ladybirds look similar, and only the seven-spot population is being counted
Ecologists used the mark-release-recapture method to estimate the population of seven-spot ladybirds in a meadow. They repeated the investigation every year for five years to monitor the population.
Give three precautions they should take each year so that the population estimates can be compared.
(3 marks)
Hint
What could change from one year to the next that would make the estimates hard to compare? Think about when, where and how they sample, and the marks they use.
Mark Scheme
Max 3 marks
- Catch the samples at the same time of year (1 mark)
- Sample in the same area of the meadow (1 mark)
- Use the same method, such as the same time between the two samples (1 mark)
- Use a different mark each year, so ladybirds marked in an earlier year aren’t counted (1 mark)
- Use a mark that doesn’t affect survival or the chance of recapture, and doesn’t rub off (1 mark)
Tips
- Answer the question asked. What keeps the estimates comparable from year to year, such as sampling at the same time, in the same place, with the same method
- Don’t give two versions of the same point, such as two ways the mark mustn’t harm the ladybirds
- Don’t just list the assumptions of mark-release-recapture (no migration, births or deaths)
Draw the general structure of an amino acid. Label the amine group, the carboxyl group and the R group.
(2 marks)
Hint
What is in the centre of the molecule? Which four groups are attached to it, and which of them is different in each amino acid?
Mark Scheme
- A central carbon bonded to NH₂, COOH, H and R (1 mark)
- The amine group, carboxyl group and R group all labelled correctly (1 mark)

Also accepted / rejected
Also accepted
- Other correct ways of drawing it, such as showing every bond in the COOH group (point 1)
Not accepted
- The hydrogens of the amine or carboxyl group bonded straight to the central carbon (point 1)
Tips
- Draw the central carbon bonded to NH₂, COOH, H and R. The hydrogens of NH₂ and COOH belong in those groups, so don’t bond them straight to the central carbon
- Check you’ve drawn an amino acid, not glucose or a nucleotide
Which statement about protein structure is correct?
Tick (✓) one box.
Hint
Which bonds hold each level of structure together? Does every protein have a quaternary structure?
Mark Scheme
C: The secondary structure of a protein is held in place by hydrogen bonds, forming an α-helix or a β-pleated sheet (1 mark)
Explanation (not marked): The tertiary structure is held by hydrogen bonds, ionic bonds and disulfide bridges, not only peptide bonds. Only proteins with more than one polypeptide chain have a quaternary structure, and disulfide bridges only form between amino acids that contain sulfur.
Tips
- Know what holds each level together. Peptide bonds hold the primary structure, hydrogen bonds the secondary structure, and hydrogen bonds, ionic bonds and disulfide bridges the tertiary structure
- Quaternary structure means more than one polypeptide chain, so not every protein has one
Antibodies are proteins made and secreted by plasma cells.
Once activated, a single B cell divides and produces 3000 plasma cells. Each plasma cell secretes 1500 molecules of antibody Q per second.
A woman has a blood volume of 4.8 dm³.
Calculate the number of molecules of antibody Q per cm³ of her blood 12 hours after these plasma cells were produced.
You can assume that none of the antibody is broken down.
Give your answer in standard form.
Answer = ________ molecules per cm³
(2 marks)
Hint
How many molecules do all the plasma cells make each second? How many seconds are there in 12 hours? How many cm³ are there in 4.8 dm³?
Mark Scheme
4.05 × 10⁷ molecules per cm³ (2 marks)
Working:
- Molecules per second from all the plasma cells: 3000 × 1500 = 4.5 × 10⁶
- Seconds in 12 hours: 12 × 60 × 60 = 43 200
- Total molecules: 4.5 × 10⁶ × 43 200 = 1.944 × 10¹¹
- Blood volume: 4.8 dm³ = 4800 cm³
- Per cm³: 1.944 × 10¹¹ ÷ 4800 = 4.05 × 10⁷
If the answer is wrong, 1 mark for any of:
- 1.944 × 10¹¹ (the total, not divided by the blood volume)
- the digits 405 with the wrong power of ten, for example from not converting dm³ to cm³
- the right answer not in standard form (40 500 000)
Also accepted / rejected
Also accepted
- 4.1 × 10⁷ or 4 × 10⁷
Tips
- Convert the blood volume to cm³ first. 4.8 dm³ = 4800 cm³
- Convert the time to seconds, because the rate is given per second
Scientists investigated whether age affects how mice respond to a vaccine.
They vaccinated young and old mice against a bacterium. On 9 different days over the next 4 weeks, they took blood from 5 young and 5 old mice and measured the mean concentration of antibodies against the bacterium.
Figure 1 shows the results.
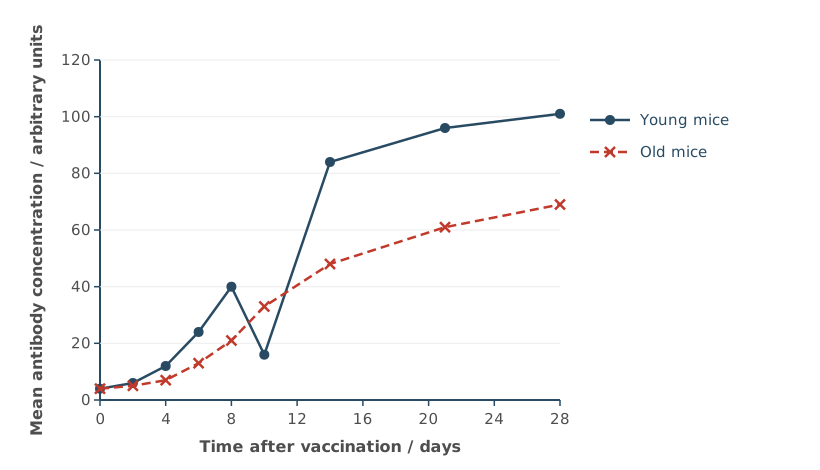
The old mice made fewer antibodies than the young mice. However, the scientists decided that more investigations were needed before they could conclude how age affects the immune response.
Suggest three reasons why.
Do not refer to statistical tests, repeats or sample size in your answer.
(3 marks)
Hint
What did the scientists measure, and which part of the immune response does that leave out? Would the results be the same for other vaccines? Is there a point on the graph that doesn’t fit, and what don’t you know about later days or about the mice?
Mark Scheme
Max 3 marks
What was measured
- Only antibodies were measured, so there’s no data on the T cell response (1 mark)
- Only one vaccine was used, so the results may not apply to other vaccines or pathogens (1 mark)
- The ages of the young and old mice aren’t given (1 mark)
The data
- The day 10 result for the young mice doesn’t fit the pattern (it’s anomalous) (1 mark)
- There are gaps after day 14, or we don’t know what happens after day 28 (1 mark)
Explanation (not marked): Antibodies are made by plasma cells, which come from B cells, so measuring antibodies only shows the B cell (humoral) part of the immune response. T cells are also part of the response, but they weren’t measured.
Also accepted / rejected
Also accepted
- “Other vaccines or pathogens need testing” (point 2)
Tips
- Use the information given. Only antibodies were measured, which shows the B cell response but not the T cell response, and the ages of the mice aren’t given
- Testing one vaccine is fine for a fair comparison, but it means the results may not apply to other vaccines or pathogens
- Look at the data. The day 10 result for the young mice doesn’t fit the pattern, there are gaps after day 14, and we don’t know what happens after day 28
- The question rules out statistical tests, repeats and sample size, so don’t use them
Congenital heart defects (CHD) are problems with the structure of the heart that are present from birth. CHD can be caused by various genetic and environmental factors, such as diabetes in the mother.
About 1 in 100 babies is born with CHD.
Despite knowing this frequency, the Hardy–Weinberg equation cannot be used to estimate any allele frequencies for CHD.
Suggest two reasons why.
(2 marks)
Hint
What does the Hardy–Weinberg equation assume about how a characteristic is inherited? Which of its conditions might not hold for CHD in humans?
Mark Scheme
Max 2 marks
- CHD isn’t caused by a single gene (1 mark)
- Environmental factors are involved, and the Hardy–Weinberg equation can’t account for them (1 mark)
- Mutations occur (1 mark)
- Human populations aren’t isolated, because people migrate (1 mark)
Explanation (not marked): Points 1 and 2 come from the information about CHD. Points 3 and 4 come from the conditions for the Hardy–Weinberg principle (no mutations and no migration), which aren’t met in real human populations. You can use either kind of reason.
Also accepted / rejected
Also accepted
- “Methylation” or “epigenetic factors” for environmental factors (point 2)
Tips
- Use the information. CHD has various genetic and environmental causes, so it isn’t controlled by one gene, and the Hardy–Weinberg equation can’t account for the environment
- Other reasons are that mutations occur and that human populations aren’t isolated
- “We don’t know if the allele is dominant or recessive” doesn’t answer it, and neither does population size
Gene H is involved in heart development in a fetus.
Describe how methylation of gene H could reduce the amount of the protein that gene H codes for.
(2 marks)
Hint
What has to bind to the promoter before a gene can be transcribed? If the gene isn’t transcribed, what isn’t made?
Mark Scheme
- Methylation prevents transcription factors (or RNA polymerase) binding to the promoter (1 mark)
- So gene H is not transcribed, and less mRNA is made to be translated (1 mark)
Also accepted / rejected
Not accepted
- “Methylation causes a mutation” (points 1 and 2)
Tips
- Be specific. Methylation stops transcription factors binding, so the gene isn’t transcribed. “The gene is switched off” is too vague
- Methylation doesn’t change the base sequence, so it isn’t a mutation
Congenital heart defects (CHD) are problems with the structure of the heart that are present from birth. CHD can be caused by various genetic and environmental factors.
Gene H is involved in heart development in a fetus.
Scientists hypothesised that some cases of CHD are caused by a “two-hit” model:
- a “genetic hit”, through loss of gene H function
- an “environmental hit”, in which high blood glucose in the mother (for example, from diabetes) causes methylation of gene H in the fetus.
Scientists tested the “two-hit” model using human heart cells grown in vitro. They:
- grew normal cells and cells with a loss of gene H function
- grew some of each type of cell in a high-glucose medium, and some in a normal-glucose medium
- measured the percentage methylation of gene H in the cells.
Table 1 shows the results.
Table 1
| Cells | Methylation of gene H in normal glucose / % | Methylation of gene H in high glucose / % |
|---|---|---|
| Normal cells | 22 | 48 |
| Cells with a loss of gene H function | 25 | 51 |
Suggest and explain three reasons why the data in Table 1 might not provide evidence for the “two-hit” model.
(3 marks)
Hint
Compare the two rows of Table 1, then the two columns. Which “hit” seems to make a difference? How is a dish of cells different from a developing baby?
Mark Scheme
Max 3 marks
- High glucose alone may cause the methylation, because methylation increased in both types of cell (1 mark)
- Loss of gene H function may have no effect, because the methylation is similar in both types of cell (22% and 25%, or 48% and 51%) (1 mark)
- A high-glucose medium was used, so it may not have the same effect as diabetes in the mother (1 mark)
- The cells were grown in vitro, so they may not respond in the same way as cells in a fetus (1 mark)
- The cells didn’t develop into a heart, so we don’t know if they would lead to CHD (1 mark)
Also accepted / rejected
Also accepted
- “In a living organism”, “in vivo” or “in a pregnancy” for in a fetus (point 4)
Tips
- “Suggest and explain” means every point needs a reason. For example, the cells were grown in vitro, so they may not respond like cells in a fetus
- Use the data. Methylation rose in both types of cell in high glucose, and it was similar in both types of cell
- “No statistical test” doesn’t use the information given
When a person breathes out forcefully, for example when coughing, the volume of the thoracic cavity decreases quickly.
Describe the roles of the internal intercostal muscles and the diaphragm in decreasing the volume of the thoracic cavity.
(2 marks)
Hint
Do the internal intercostal muscles contract or relax, and which way do they move the ribs? Does the diaphragm contract or relax, and which way does it move?
Mark Scheme
- The internal intercostal muscles contract, pulling the ribs down and in (1 mark)
- The diaphragm relaxes and moves up (becomes dome-shaped) (1 mark)
Also accepted / rejected
Also accepted
- “The diaphragm is pushed up by the organs below it” (point 2)
Not accepted
- The diaphragm contracting (point 2)
Tips
- Muscles contract or relax. They don’t “expand”, and they don’t push on the lungs
- When breathing out forcefully, the internal intercostal muscles contract and pull the ribs down and in, and the diaphragm relaxes and moves up
Lung volume can be measured with a spirometer using the helium dilution method. The lung volume, V2, is calculated using the equation
V2 = V1 (C1 − C2)C2
where:
- C1 = the starting concentration of helium in the spirometer
- C2 = the concentration of helium in the spirometer once it is the same as in the lungs
- V1 = the volume of gas in the spirometer.
A student used a spirometer containing 2800 cm³ of gas, with a starting helium concentration of 12%. They found that C2 was 4.5%.
Use the equation to calculate the student’s lung volume in dm³.
Give your answer to 3 significant figures.
Show your working.
Answer = ________ dm³
(2 marks)
Hint
Put the numbers into the equation in the order shown. Is your answer in cm³ or dm³? How many cm³ are there in 1 dm³?
Mark Scheme
4.67 dm³ (2 marks)
Working:
- C1 − C2 = 12 − 4.5 = 7.5
- V2 = 2800 × 7.5 ÷ 4.5 = 4666.7 cm³
- In dm³: 4666.7 ÷ 1000 = 4.67 dm³
If the answer is wrong, 1 mark for any of:
- 4666.7 or 4667 (the answer in cm³)
- the digits 467 with the wrong power of ten
- 4.66 (not rounded correctly)
Tips
- Work out C1 − C2 first, then multiply by V1 and divide by C2
- Convert cm³ to dm³ by dividing by 1000, and round correctly. 4.666… rounds to 4.67, not 4.66
Farmer’s lung is a lung disease caused by breathing in spores from mouldy hay. In people who are sensitive to the spores, symptoms usually start 4 to 8 hours after breathing them in, and get better when the person stays away from the hay.
Farmer’s lung can be diagnosed with a biopsy, in which a small piece of lung tissue is removed and examined with a microscope.
It can also be diagnosed without a biopsy. Five conditions must be met. Three of these are:
- a lung scan showing inflamed lung tissue
- reduced gas exchange
- shortness of breath.
These three conditions are also found in many other lung diseases.
Using the information provided, suggest the other two conditions that must be met before farmer’s lung can be diagnosed without a biopsy.
(2 marks)
Hint
What makes farmer’s lung different from the other lung diseases? Look at what causes it, and when the symptoms appear.
Mark Scheme
- The person has been exposed to mouldy hay (or its spores) (1 mark)
- The symptoms start 4 to 8 hours after exposure, or they get better away from the hay (1 mark)
Also accepted / rejected
Also accepted
- Working on a farm with hay (point 1)
Tips
- Use the information in the passage. The person must have breathed in the spores, and the symptoms must follow the pattern described
- Don’t give general symptoms such as a cough, or repeat the three conditions already given
Farmer’s lung is a lung disease caused by breathing in spores from mouldy hay. In people who are sensitive to the spores, symptoms usually start 4 to 8 hours after breathing them in, and get better when the person stays away from the hay.
Farmer’s lung can be diagnosed with a biopsy, in which a small piece of lung tissue is removed and examined with a microscope.
It can also be diagnosed without a biopsy. Five conditions must be met. Three of these are:
- a lung scan showing inflamed lung tissue
- reduced gas exchange
- shortness of breath.
These three conditions are also found in many other lung diseases.
Suggest two advantages and one disadvantage of diagnosing farmer’s lung without a biopsy.
(3 marks)
Hint
What does a biopsy involve, and what risks does it carry? Without a sample of lung tissue, how sure can the doctor be?
Mark Scheme
Max 3 marks. Max 2 marks for advantages.
Advantages
- It’s less invasive or less painful (no surgery) (1 mark)
- There’s less risk of lung damage or infection (1 mark)
- It’s cheaper or quicker (1 mark)
Disadvantage
- The diagnosis is less certain, because the three conditions are also found in other lung diseases (1 mark)
Tips
- Think about the patient and the procedure. It’s less invasive, with less risk of lung damage or infection, and it’s cheaper and quicker
- For the disadvantage, use the passage. Three of the conditions are shared with other lung diseases, so the diagnosis is less certain
Idiopathic pulmonary fibrosis (IPF) is a lung disease in which alveolar epithelial cells die and are replaced by scar tissue. The scar tissue is thick and inelastic. There is no cure for IPF, but some drugs can slow it down.
Doctors gave a new drug, drug F, to 150 patients with IPF. Drug F slows the formation of scar tissue. 18 of the patients had to stop taking drug F because of side effects.
The doctors recorded how long each patient lived after starting the drug, and compared this with survival data for previous patients with IPF, who were treated before drug F was used.
Figure 1 shows the results.
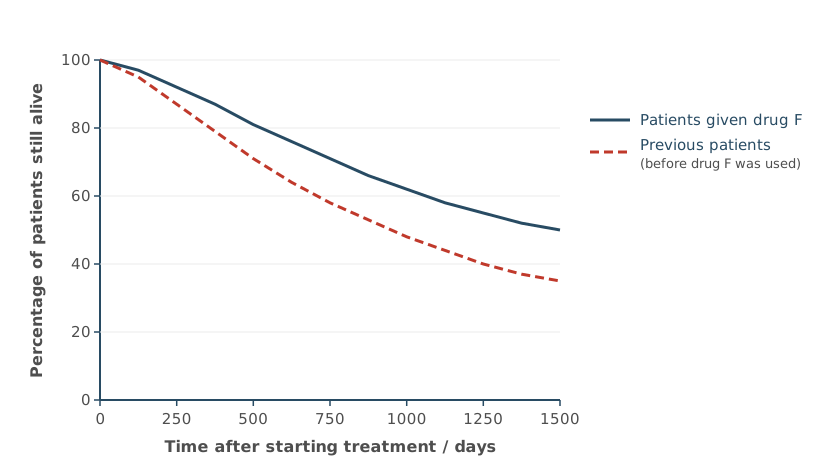
Suggest why the doctors did not use a control group of patients who were given no treatment.
(1 mark)
Hint
Who would be in the control group, and what would happen to them?
Mark Scheme
It would be unethical to leave patients with a serious disease untreated, when drugs that slow it down already exist (1 mark)
Also accepted / rejected
Also accepted
- “Unethical to give patients a placebo”
Tips
- A control group here would be patients with IPF given no treatment, and it would be unethical to leave them untreated
- The control group wouldn’t be healthy people given the drug
Idiopathic pulmonary fibrosis (IPF) is a lung disease in which alveolar epithelial cells die and are replaced by scar tissue. The scar tissue is thick and inelastic. There is no cure for IPF, but some drugs can slow it down.
Doctors gave a new drug, drug F, to 150 patients with IPF. Drug F slows the formation of scar tissue. 18 of the patients had to stop taking drug F because of side effects.
The doctors recorded how long each patient lived after starting the drug, and compared this with survival data for previous patients with IPF, who were treated before drug F was used.
Figure 1 shows the results.
Chronic farmer’s lung is a long-term form of farmer’s lung. Breathing in the spores again and again causes inflammation, and over time scar tissue forms in the lungs, as in IPF.
The doctors concluded that drug F increases survival in patients with IPF.
Using all the information, evaluate whether drug F should be considered as a treatment for chronic farmer’s lung.
(4 marks)
Hint
What do the two diseases have in common, and how are they different? What does Figure 1 show? What are the limits of how drug F was tested?
Mark Scheme
Max 4 marks. Max 3 marks from either side.
For
- Both diseases involve scar tissue forming in the lungs, and drug F slows scar tissue formation (1 mark)
- A higher percentage of the patients given drug F were still alive, for example 50% compared with 35% at 1500 days (1 mark)
- It was tested in humans, over a long time (about 4 years) (1 mark)
Against
- It’s not a cure, it only slows the formation of scar tissue (1 mark)
- It doesn’t treat the cause of farmer’s lung (the reaction to the spores), so the person must still avoid the hay (1 mark)
- It was only tested on patients with IPF, not farmer’s lung (1 mark)
- There was no control group, and the previous patients may have differed in other ways, such as the other care they received (1 mark)
- Side effects, since 18 of the 150 patients (12%) had to stop taking it (1 mark)
Also accepted / rejected
Also accepted
- Side effects as a point for drug F, since only 12% of patients had to stop taking it (point 8)
Tips
- Give both sides, using the information. Both diseases form scar tissue and drug F slows this, but it isn’t a cure and it was only tested on IPF
- Mention the side effects, since 18 of the 150 patients had to stop taking the drug
- Comparing with previous patients isn’t the same as a control group, because other things may have changed over time
- Avoid rote answers such as “no statistical test” or “correlation doesn’t mean causation”
Write an essay on the following topic.
The importance of condensation and hydrolysis reactions in biological systems.
(25 marks)
Hint
Choose four or five topics from different parts of the course where a condensation or hydrolysis reaction happens. For each one, what bonds are made or broken, and why does that matter?
Mark Scheme
Example plan
There are many topics you could choose, and this is just one selection. Each topic has an AO1 point (knowledge) and an AO2 point (why it’s important for the title).
Storage polysaccharides (3.1.2)
- AO1: Condensation reactions join glucose molecules with glycosidic bonds. This makes starch in plants and glycogen in animals. Hydrolysis breaks these bonds to release glucose again.
- AO2: Starch and glycogen are compact and insoluble, so they don’t affect water potential. The glucose is released when cells need it for respiration.
Protein synthesis (3.4.2)
- AO1: During translation, tRNA brings amino acids to the ribosome. Condensation reactions join them with peptide bonds.
- AO2: This builds the primary structure in the order set by the mRNA. The protein then folds into the right shape to carry out its function.
DNA replication (3.1.5.2)
- AO1: DNA polymerase joins free nucleotides by condensation reactions. This forms phosphodiester bonds.
- AO2: Accurate copies of DNA are made before a cell divides. Each daughter cell gets the same genetic information.
ATP (3.1.6)
- AO1: ATP hydrolase hydrolyses ATP to ADP and phosphate. This releases energy. ATP synthase makes ATP again by condensation.
- AO2: ATP is an immediate energy source that is quickly remade. It provides energy for active transport and muscle contraction.
Digestion (3.3.3)
- AO1: Digestive enzymes hydrolyse large molecules.
- Proteins: endopeptidases and exopeptidases hydrolyse peptide bonds. Dipeptidases then release amino acids.
- Lipids: lipase hydrolyses the ester bonds in triglycerides. This gives fatty acids and monoglycerides.
- AO2: Large molecules become small, soluble ones. These can be absorbed in the ileum and used by cells.
Beyond the specification: lactose intolerance
- AO1: Some adults make little lactase, so lactose isn’t hydrolysed in the small intestine. In the large intestine, bacteria ferment it (anaerobic respiration) and produce gases such as carbon dioxide and hydrogen.
- AO2: The gas causes pain and bloating. The lactose also lowers the water potential in the intestine, so water moves in by osmosis and causes diarrhoea. It shows how important hydrolysis is for digestion.
How it’s marked (25 marks: 13 for AO1 and 12 for AO2)
| Marks | What the essay looks like |
|---|---|
| 21–25 | Several topics from different areas, each clearly linked to the title, so the essay reads as a whole. Detailed, accurate A-level biology, with no significant errors or irrelevant material. The very top marks need relevant material from beyond the specification. |
| 16–20 | Several topics linked to the title and clearly explained, but some points less developed. Perhaps one significant error or one irrelevant topic. |
| 11–15 | Suitable topics, but not linked to the title. Usually correct A-level biology that lacks detail. Some significant errors, or more than one irrelevant topic. |
| 6–10 | Mainly one or two relevant topics. Some A-level content, but it’s superficial or poorly explained, and may have several errors. |
| 1–5 | Only indirectly about the title. A list of facts, mostly below A-level, often with errors. |
For more on planning and writing the essay, see the Essay Guidance page.
Tips
- Keep every paragraph about condensation or hydrolysis. Summarise the rest of a topic briefly, rather than writing a page on it and only mentioning the reaction at the end
- Explain why each reaction matters (AO2), not just what happens
- Avoid these errors. Hydrogen bonds aren’t hydrolysed, reduced coenzymes aren’t made by condensation, myosin doesn’t bind to actin by condensation, and the stages of the nitrogen cycle aren’t condensation or hydrolysis
- Cover at least four different sections of the specification. Introductions and conclusions don’t earn marks
Write an essay on the following topic.
The importance of responses to changes in the internal and external environment of organisms.
(25 marks)
Hint
Choose four or five topics from different parts of the course where an organism responds to a change. For each one, what is the change, how does the organism respond, and why does the response matter?
Mark Scheme
Example plan
There are many topics you could choose, and this is just one selection. Each topic has an AO1 point (knowledge) and an AO2 point (why it’s important for the title).
Tropisms and kineses (3.6.1.1)
- AO1:
- Tropism (plants): When light comes from one side, IAA moves to the shaded side of a shoot. More cell elongation happens there, so the shoot bends towards the light.
- Kinesis (woodlice): Woodlice move faster and turn less in dry conditions.
- AO2:
- The shoot gets more light, so photosynthesis makes more glucose. This is used for respiration and growth, and any extra is stored as starch.
- The woodlice end up in damp places, where they lose less water.
Receptors (3.6.1.2)
- AO1: Pressure deforms a Pacinian corpuscle and opens stretch-mediated sodium ion channels. Sodium ions diffuse in and produce a generator potential. If it reaches threshold, an action potential is produced.
- AO2: Pressure is the stimulus. The receptor turns it into nerve impulses, so the organism can respond to touch and vibration, for example by adjusting how hard it grips an object.
Control of heart rate (3.6.1.3)
- AO1: During exercise, carbon dioxide rises and blood pH falls. Chemoreceptors detect this and send more impulses to the medulla. The medulla sends more impulses along the sympathetic nerve to the SAN, so heart rate increases.
- AO2: More oxygen reaches the muscles for aerobic respiration, so they can make more ATP for contraction. Carbon dioxide is removed faster.
Control of blood glucose (3.6.4.2)
- AO1: After a meal, β cells secrete insulin. Insulin binds to receptors and more glucose transport proteins move into cell-surface membranes. Glucose is converted to glycogen. When glucose falls, glucagon causes glycogen breakdown and gluconeogenesis.
- AO2: Blood glucose stays within narrow limits. Cells always have glucose for respiration, and the water potential of the blood stays stable.
The immune response (3.2.4)
- AO1: When a pathogen enters, B cells with complementary receptors are selected. They divide by mitosis. Plasma cells secrete antibodies and memory cells remain.
- AO2: Pathogens are destroyed before they cause serious disease. A second infection gets a faster, stronger response.
Beyond the specification: closing stomata in drought
- AO1: When the soil is dry, roots release the hormone abscisic acid (ABA). It makes potassium ions leave the guard cells, which raises their water potential, so water leaves by osmosis. The guard cells lose turgor and the stomata close.
- AO2: Less water is lost by transpiration, so the plant doesn’t wilt.
How it’s marked (25 marks: 13 for AO1 and 12 for AO2)
| Marks | What the essay looks like |
|---|---|
| 21–25 | Several topics from different areas, each clearly linked to the title, so the essay reads as a whole. Detailed, accurate A-level biology, with no significant errors or irrelevant material. The very top marks need relevant material from beyond the specification. |
| 16–20 | Several topics linked to the title and clearly explained, but some points less developed. Perhaps one significant error or one irrelevant topic. |
| 11–15 | Suitable topics, but not linked to the title. Usually correct A-level biology that lacks detail. Some significant errors, or more than one irrelevant topic. |
| 6–10 | Mainly one or two relevant topics. Some A-level content, but it’s superficial or poorly explained, and may have several errors. |
| 1–5 | Only indirectly about the title. A list of facts, mostly below A-level, often with errors. |
For more on planning and writing the essay, see the Essay Guidance page.
Tips
- For each topic, describe a response to a change in the internal or external environment, not just a process
- Explain why each response is important (AO2) at A-level depth
- Insulin doesn’t cause ATP to be converted to cyclic AMP. The second messenger model is for adrenaline and glucagon
- Temperature control from GCSE doesn’t count as material beyond the specification
- Cover at least four different sections of the specification. Introductions and conclusions don’t earn marks
Also accepted